
 XM
XM Bybit
Bybit Binance
 Robinhood
 Webull
 IC Markets
 Pepperstone
 OKX
OKX Vantage
 VT Markets
 BingX
BingX Gate.io
 Kucoin
 MEXC
MEXC Exness
 Bitget
The Inside Bar candlestick pattern is one of the most frequently appearing candlestick patterns on financial market charts. Integrating the Inside Bar candlestick strategy can enhance a trader’s market analysis skills.
At the same time, it is also one of the most effective tools in the price action trading approach. It complements the trading strategy and helps improve long-term trading performance. Let’s begin with some basic concepts about what Inside Bars are and dive into the in-depth theory of the Inside Bar pattern.
1. WHAT IS INSIDE BAR CANDLE?
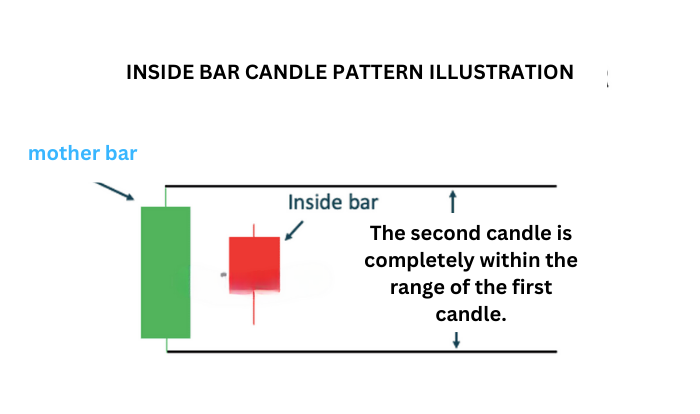
The Inside Bar candle is a very popular reversal/continuation candlestick pattern; it consists of 2 candles. This pattern is a real-life scenario of market psychology in the short term.
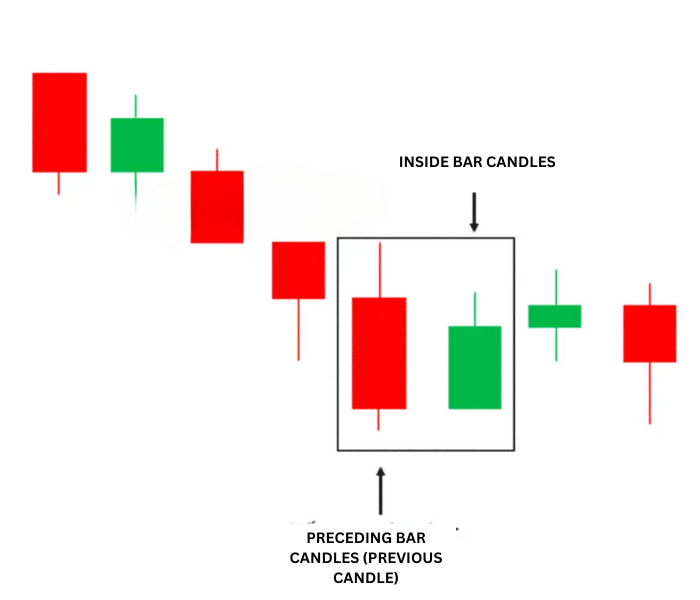
This pattern shows indecision in the market. In other words, neither side is in control of the market. The inside bar candlestick pattern usually signals:
– Consolidation: The market pauses before following the new breakout direction of the inside bar pattern
– Indecision: The market does not make new highs or lows because market participants are uncertain about the next direction.
1.1. How to identify the inside bar candlestick pattern
The following steps are used to identify the inside bar pattern on a forex chart:
– Identify the previous trend using price action/technical indicators
– Next, identify the pattern consisting of two consecutive candles. In which the second candle is smaller and completely inside the first candle. The second candle can be a doji candle and is often called an inside bar doji.
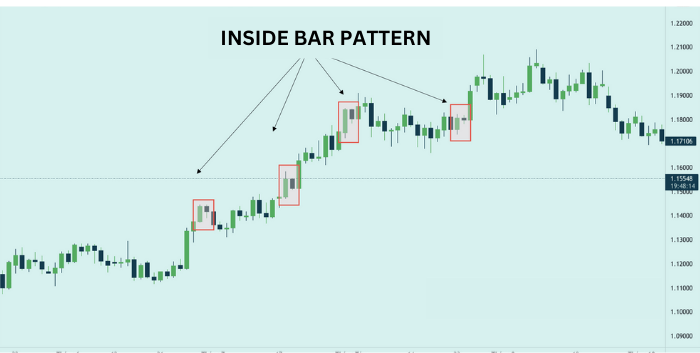
Below is a practical example of some Inside Bar candlestick patterns on a forex chart. It can be observed that the Inside Bar pattern can appear in both uptrends and downtrends as a continuation pattern. Additionally, it can also appear at the end of a trend as a reversal Inside Bar.
1.2. Market Psychology Behind the Inside Bar Candle
The Inside Bar candlestick pattern essentially reflects hesitation during a period of accumulation in the market. As mentioned above, this pattern usually appears after a strong price movement in the market. The Inside Bar pattern marks a point where the price pauses to accumulate before making the next move.
However, it can sometimes form at the top or bottom of a trend. In that case, the Inside Bar candlestick pattern acts as a reversal signal from a key support or resistance zone.
The Inside Bar candlestick pattern is considered a low volatility range, and the price action that follows this candlestick pattern can be very strong, creating excellent swing trading opportunities. Therefore, the highest and lowest points of the mother bar act as support or resistance levels in the short term.
2.1. Double Inside Bar Pattern
The Double Inside Bar, also known as the two Inside Bars pattern, consists of two Inside Bars following a mother bar (the first candle). It is quite common in the market. Sometimes, after the mother bar, there can be up to three or four Inside Bars.
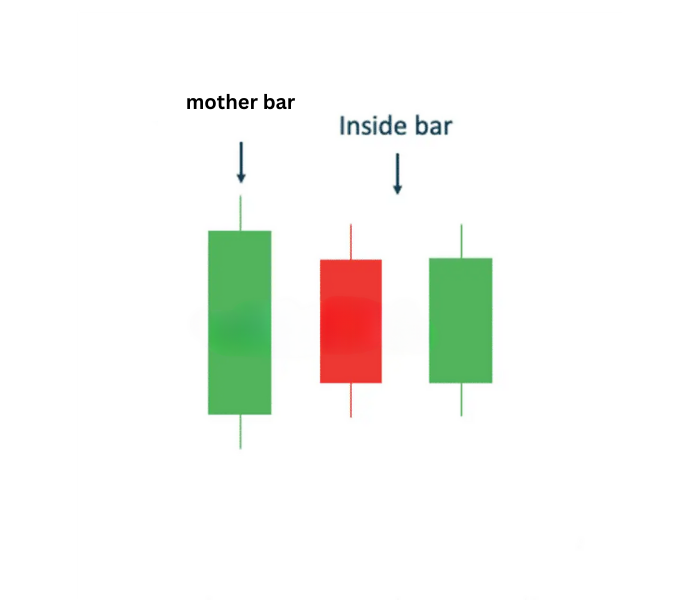
These patterns signal a prolonged period of market indecision. At the same time, they can appear before extremely strong breakout moves.
2.2. Coiling Inside Bar Pattern
The Coiling Inside Bar pattern occurs when two or more Inside Bars follow each other like a spring, fully contained within the first candle.
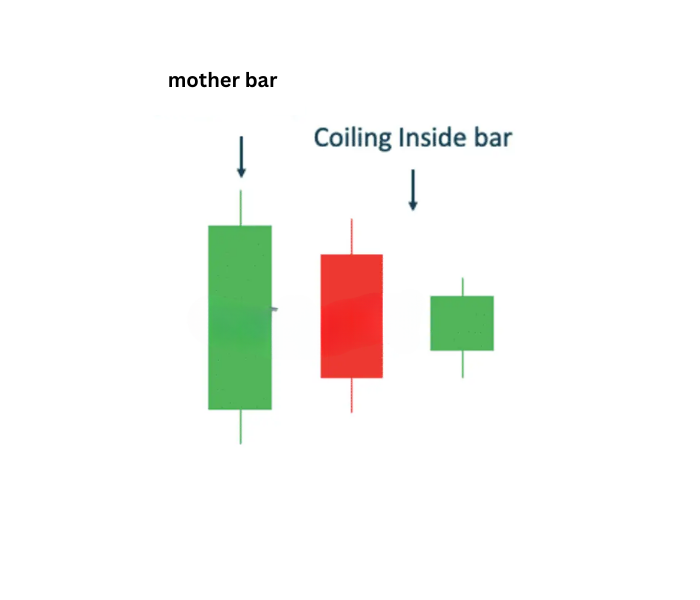
The Coiling Inside Bar pattern indicates that the market is “contracting,” much like a tightly wound spring. Eventually, it will “snap” and produce a strong move (in many cases). Therefore, when you see this pattern in the market, pay close attention to it.
2.3. What is a Fakey Candle?
Another variation of the Inside Bar, but just as important, is the Inside Bar Fakey pattern. A Fakey Candle occurs when a false breakout follows the Inside Bar pattern. Because of this, it is also known as the Inside Bar Fakey pattern.
After the Inside Bar pattern forms, the price moves in one direction but then reverses sharply, creating a false breakout that deviates from the structure of the Inside Bar pattern. Look at the illustration below to better understand the Inside Bar Fakey pattern.
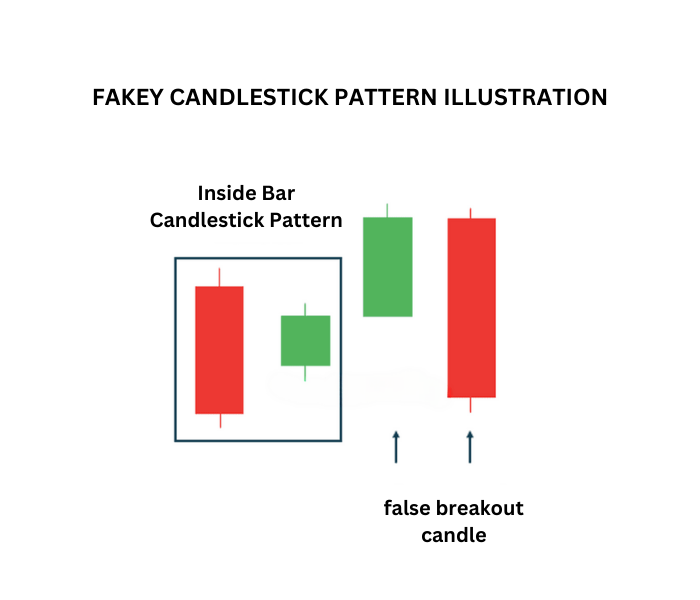
Inside Bar + False-Breakout = Fakey
Note that not every Fakey signal appears with the Inside Bar pattern. You may also encounter a three-candle breakout, although this is quite rare.
2.4. The Combined Inside Bar Pin Bar Pattern
As you know, the Pin Bar candle signal is one of the best candlestick patterns to trade. The Pin Bar is also one of the most frequently occurring candlestick patterns in trading. When you spot a Pin Bar pattern that is also within an Inside Bar pattern, you have identified the combined Inside Bar Pin Bar pattern.
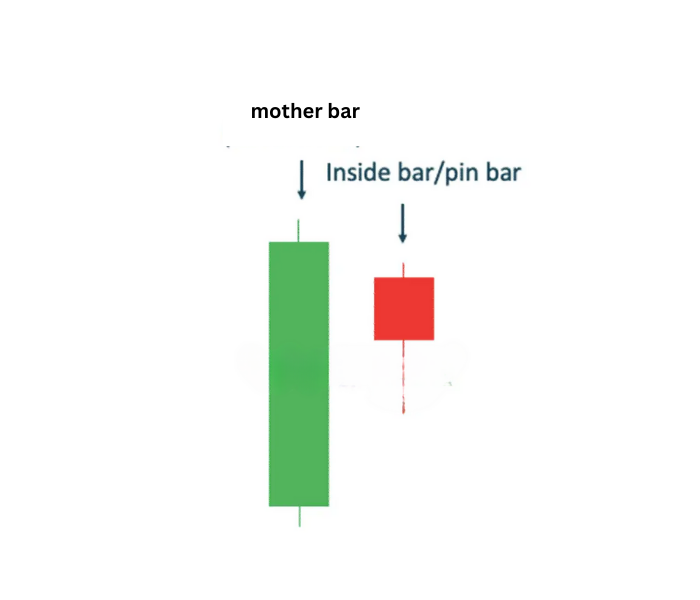
When you have a Pin Bar combined within an Inside Bar, you get a Pin Bar with a tail/shadow that indicates the potential next direction of the market.
Therefore, an Inside Bar is not just a moment of market hesitation; it is also a pause with an additional layer of confluence behind it, and as a result, it becomes a stronger price action signal.
3. DEEP DIVE INTO THE FAKEY CANDLE PATTERN
3.1. Types of Fakey Candles
The Fakey candle pattern (fakey pattern) is divided into: bullish fakey candles and bearish fakey candles.
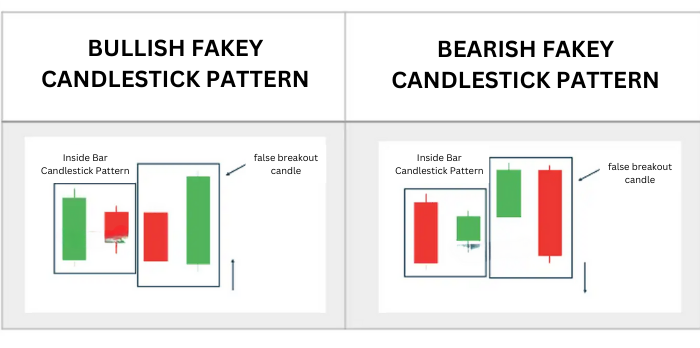
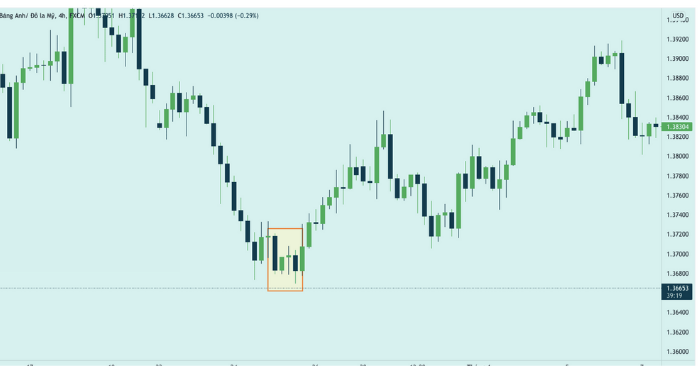
A bullish Fakey candle setup forms when the market is in a downtrend. If it forms at support levels, it is considered a reversal signal indicating a potential bullish move.
Conversely, a bearish Fakey candle setup forms during an uptrend in the market. If it forms at resistance levels, it is considered a reversal signal indicating a potential bearish move.
In addition to the two standard types of Fakey patterns, the Fakey pattern can also appear with a Pin Bar. The Fakey pattern is formed when a Pin Bar with a long shadow breaks the highest/lowest point of the Inside Bar pattern.
3.2. How to Identify the Fakey Candle Pattern
In an ideal Fakey pattern setup, the candles will form in the following order:
– The Inside Bar pattern forms.
– The next candle breaks the highest/lowest point of the just-formed Inside Bar pattern. However, this is a false breakout.
– Then, the next candle forms in the opposite direction of the breakout candle.
Below is an example of a real-life Fakey candlestick pattern:
We can see candlestick patterns at locations such as:
- Key support/resistance levels
- Fibonacci retracement levels, often at the 61.8% Fibonacci level
- When the price touches a trendline or a price channel trendline.
3.3. Trading the Fakey Candle Pattern Setup
Trading the Fakey candle pattern setup provides traders with a high-probability trading opportunity. The Fakey candle pattern can be traded in trending markets, ranging markets, or against the trend when it forms at important levels in the market.
The most common entry points for Fakey bar setups are:
- If the Fakey pattern forms a Pin Bar, traders can trade using the Pin Bar entry/exit strategy.
- Enter a trade when the price breaks the highest/lowest point of the Inside Bar or mother bar. This can be done using market orders or stop orders.
Let’s take a closer look at how to trade Fakey setups with the following real-life examples:
3.3.1. Trading in a Trending Market
The chart above shows an example of the Fakey candle pattern forming in a trending market. The market is in a short-term uptrend, followed by a period of price consolidation within a range.
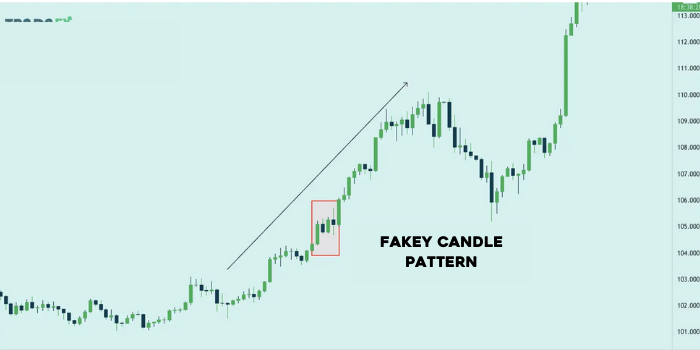
Here, traders can enter a buy order when the final bearish candle of the Fakey pattern forms. Set the stop loss at least 2 pips below the lowest point of the Fakey pattern.
The chart below will show traders the Fakey candlestick pattern with the false breakout candle being the Pin Bar.
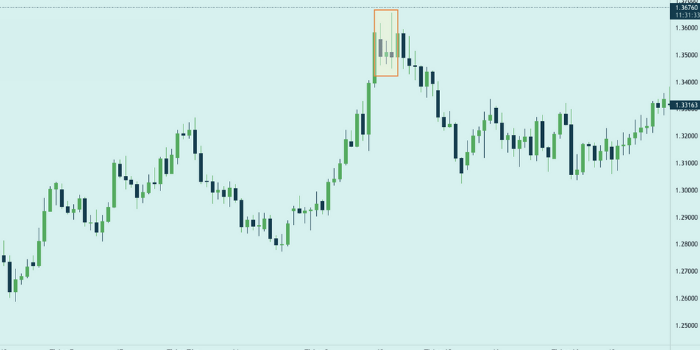
The market is also in a period where the dominant trend is a bullish trend. After the Inside Bar pattern forms, a bearish Pin Bar appears with a long upper shadow, breaking both the highest and the lowest points of the Inside Bar.
Traders can place a sell pending order (a limit order) at least a few pips below the Pin Bar, so when the price breaks lower, it will trigger your pending order. The stop loss can be placed above the highest point of the Fakey pattern.
3.3.2. Trading from Key Levels
Let’s now consider the Fakey pattern forming at key levels such as support/resistance levels. This suggests that the price could move against the current dominant market trend.
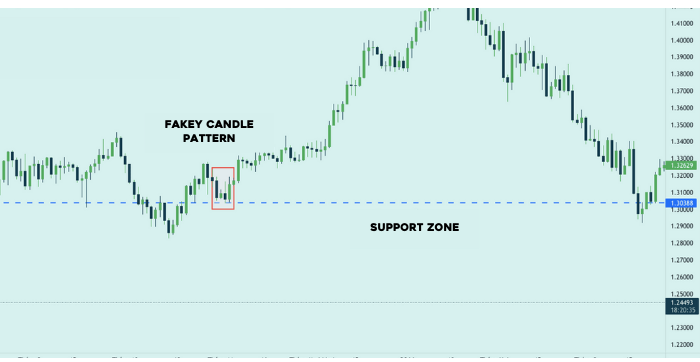
This is a buy signal from a bullish Fakey pattern formed at a support level. Note that the market has clearly pushed the price lower before forming the Fakey candle. When the Fakey pattern forms, it also slightly breaks through the support level. We can see significant buying activity after this Fakey pattern.
Placing the order here is similar to the previous section. If you pay close attention, the breakout candle here is a Pin Bar. You can enter the buy order after the last candle of the Fakey pattern closes or place a pending order above the high of the Pin Bar. The stop loss can be placed below the lowest point of the Fakey pattern.
4. TRADING THE INSIDE BAR CANDLE PATTERN IN FOREX
Basically, there are two main ways to trade the Inside Bar pattern: as a continuation signal or as a reversal pattern.
The easiest way to trade them is on the daily chart. However, Inside Bars are particularly strong at support/resistance levels when they indicate a reversal. Let’s look at some examples:
4.1. Trading Inside Bars as Continuation Moves
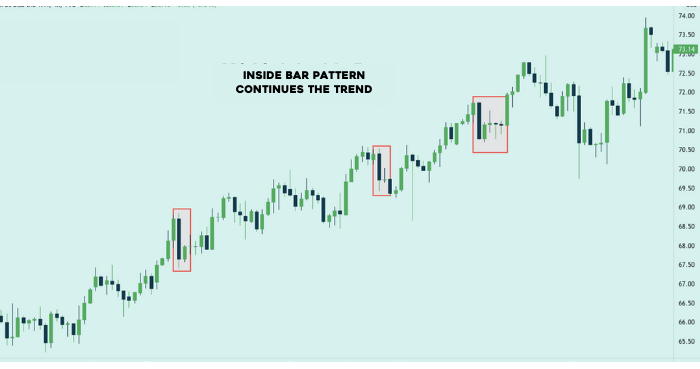
The bullish Inside Bar pattern is more beneficial in trending markets. This is because trading with the trend typically offers a higher success rate. Inside Bars often lead to a breakout or continuation of an existing trend. They can create a solid structure for trading with pyramiding and achieving profits.
4.2. Trading Inside Bars as Reversal/Resistance Patterns
Sometimes, you can trade an Inside Bar pattern as a reversal or resistance pattern, where the price is halted at a certain level, leading to a reversal. In the chart below, you can see an example of a reversal signal from an Inside Bar.
Note that the Inside Bar has formed at a significant resistance level on the chart, signaling that the market is hesitant and “uncertain” about whether it wants to move to any higher levels. We can see a bullish move occurring when the price breaks above the high of the mother bar.
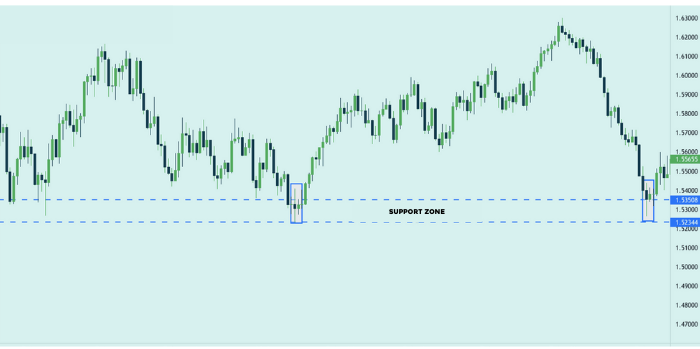
Trading Tip: Avoid trading Inside Bars at key resistance or support levels until they have been broken, as Inside Bars often create false breakouts at important levels multiple times.
4.3. Inside Bar Breakout Strategy
As mentioned earlier, the Inside Bar candlestick pattern represents a short-term consolidation phase with low volatility in a trending market. Traders can then look for breakout trades once a new high or low is formed.
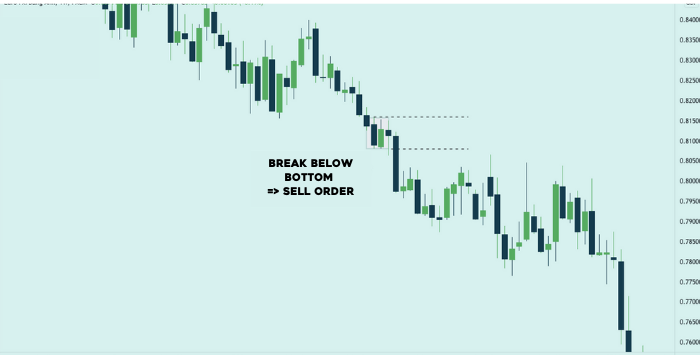
Look at the EUR/GBP chart below. The previous trend is seen by the lower highs and lower lows. The breakout occurs below the lowest point of the “previous candle” in the Inside Bar pattern, triggering a sell entry on the market.
5. TIPS FOR TRADING INSIDE BAR PATTERNS
– For beginner traders, using the Inside Bar pattern to trade with the prevailing trend is easier than using it to capture reversal points.
– The Inside Bar pattern is most effective on the daily time frame. Because Inside Bars appear frequently, their presence on lower time frames often leads to less accurate signals.
– The smaller the range of the Inside Bar relative to the Mother Bar, the higher the probability of a successful trade. Ideally, the Inside Bar should be located in the upper or lower half of the Mother Bar.
– Be cautious of both the Mother Bar and Inside Bar having wide ranges. These can often lead to false signals and make risk management more challenging.
– It is common to see three or even four Inside Bars completely contained within the first bar. This simply indicates a longer accumulation phase, which typically leads to a stronger breakout.
– Practice trading with Inside Bar strategies on a demo account to understand its limitations before trading with real money.
– The Inside Bar pattern often offers a favorable risk-reward ratio with tight stop losses, leading to significant breakouts when price moves strongly in one direction.
6. CONCLUSION
Trading the Inside Bar pattern can be highly profitable if you trade it correctly and understand the fundamental forex knowledge. However, the Inside Bar alone cannot form a standalone trading strategy.
This means that you shouldn’t just look for Inside Bar patterns to enter a trade. Instead, you should search for specific setups and then see if the Inside Bar pattern forms to provide a valid entry signal.
When traded correctly, the Inside Bar pattern can yield high-probability trades with successful outcomes.
- t.me/finance_solutes
- Website: https://finance-solutes.com
- Hotline: +1 929 5636 439 ( Hotline )
- 26 Broadway, Suite 934, New York, 10004, US
