
 XM
XM Bybit
Bybit Binance
 Robinhood
 Webull
 IC Markets
 Pepperstone
 OKX
OKX Vantage
 VT Markets
 BingX
BingX Gate.io
 Kucoin
 MEXC
MEXC Exness
 Bitget
Support resistance is a crucial key in trading. Most trading strategies incorporate some form of support-resistance (S/R) analysis. Support-resistance tends to form around key areas where the price has frequently approached and then bounced back.
The ability to accurately draw support-resistance levels is one of the most fundamental skills every price action trader must have. It also serves as the foundation for everything that follows, including price action trading strategies like Pin Bar and Inside Bar, as well as the appropriate risk-to-reward ratio.
This article will introduce the concept of support-resistance, explain why it forms, and delve into how to correctly identify these levels. Lastly, it will cover some essential rules for trading.
1. WHAT IS SUPPORT RESISTANCE?
Support-resistance is among the most widely used technical indicators in the financial markets. It offers a simple method to quickly analyze charts to identify three points of interest for traders:

- Market Trends
- Identifying Entry Points
- Setting Exit Points for Profit or Loss
If traders can answer the above points, they essentially have a trading idea. Identifying support/resistance levels on the chart can answer those questions. Knowing how to identify and draw resistance and support lines in forex is one of the most crucial skills.
| SUPPORT ZONE | RESISTANCE ZONE |
| A support level is an area on the chart where the price has fallen but couldn’t break through or move past this zone. The chart above shows how the price drops to the support zone and then “bounces” back up strongly. | The support theory suggests that the price level is strong enough to prevent further decline. The rationale is that as the price approaches the support level and becomes lower in the process, buyers will see a better trading opportunity and are more likely to buy. Sellers become less active because they would get a worse deal. At this point, demand will exceed supply, preventing the price from falling below the support level. |
| A resistance level is an area on the chart where the price has risen but couldn’t break through this zone to move higher. The chart above shows how the price rises to the resistance zone and then “bounces” back down strongly. | The resistance level is the price level at which supply (selling pressure) is strong enough to prevent the price from rising further. The logic behind this is that as the price nears the resistance level and becomes more expensive, sellers are more likely to sell, while buyers become less active. At this point, supply will exceed demand, preventing the price from surpassing the resistance level. |
1.1. Support and Resistance Example
Technical analysts use support and resistance levels to identify price points on the chart where the odds favor a pause or reversal of the ongoing trend.
Support, support level, or support zone refers to a price level or area where an asset does not fall below within a timeframe. Simply put, the price touches the support level and bounces back without breaking through it.
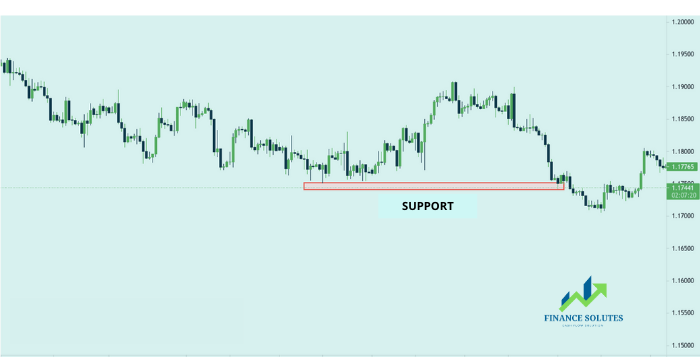
In technical analysis, a simple support level can be charted by drawing a line along the lowest points within the considered timeframe.
Support can be a straight line; sometimes, it can also be diagonal, sloping upwards or downwards according to the general price trend. Some traders use moving averages as dynamic support and resistance levels.
Applying trend lines or combining moving averages provides a more flexible view of support.
Resistance, resistance zone, or resistance level is the price level at which upward movement meets pressure due to the increasing presence of sellers wanting to sell at that price. Simply put, when the price reaches that level, it tends to reverse and decrease instead of breaking through for a period of time.
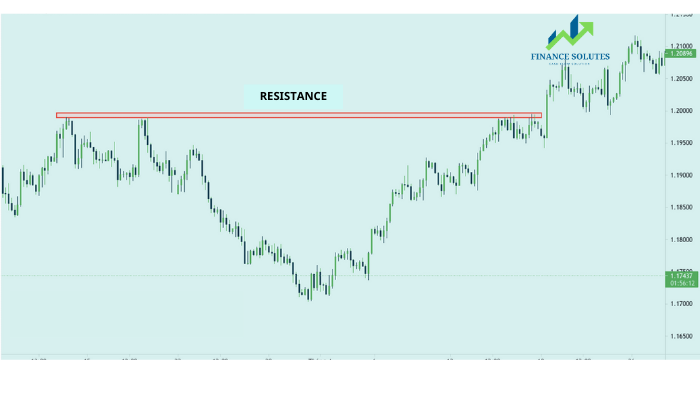
Conversely to the support level, resistance is drawn on the chart by plotting a line along the highest points within the considered timeframe. Similar to support, resistance can be straight lines or slope upwards or downwards depending on the market trend.
The resistance level represents a point or zone where the price has struggled to break through during the observed period.
1.2. Role Reversal of Resistance vs. Support
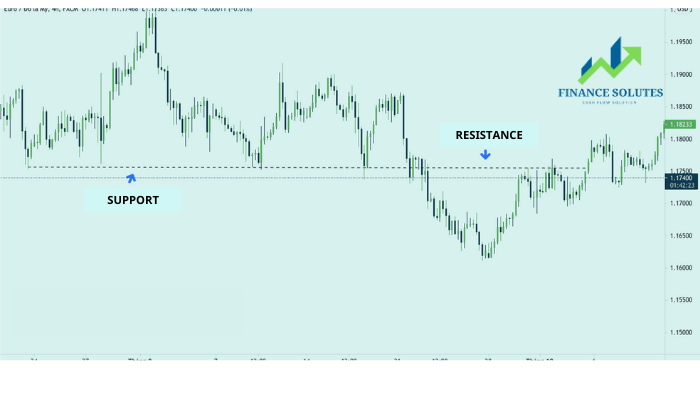
This role reversal occurs when a resistance or support level is breached, causing its role to switch. When the price breaks through a support or resistance level, it’s believed that supply and demand have shifted, leading the broken level to reverse its role.
A previous support level will become resistance as the price attempts to rise again. Conversely, a previous resistance level may become support during a temporary price pullback.
Let’s look at the example below to understand this concept more clearly:
1.3. Disadvantages of Support and Resistance
Support and resistance are considered concepts in technical analysis rather than actual technical indicators.
Support and resistance are widely used in breakout strategies. Sometimes, the price doesn’t truly break through the support or resistance levels but instead breaks temporarily and then continues in the original trend. This is known as a false breakout. Many traders, especially beginners, find trading based on support and resistance quite simple and often fall into this market trap.
1.4. Causes of Support and Resistance Formation
To understand the reasons behind the formation of these levels, we return to the supply and demand curve.
Pay attention to the supply curve below: the number of units sold increases as the price rises. In trading scenarios, the higher the price, the more willing traders are to sell their positions.
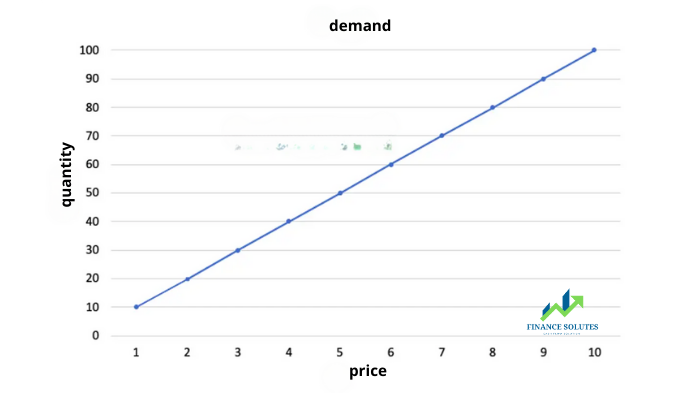
On the other hand, the demand curve is exactly the opposite. As the price increases, the number of units purchased decreases. This is because traders are less willing to buy in a more expensive market.
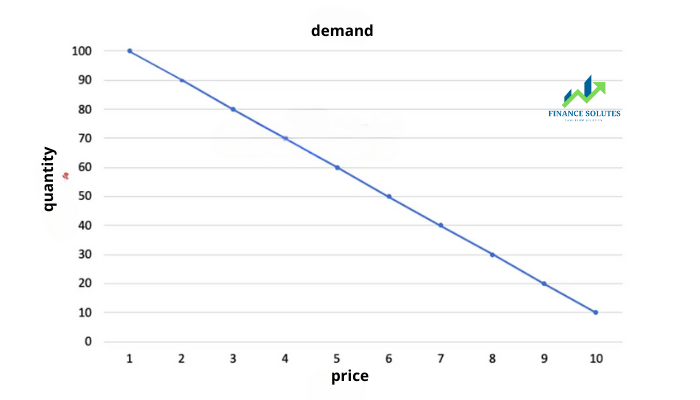
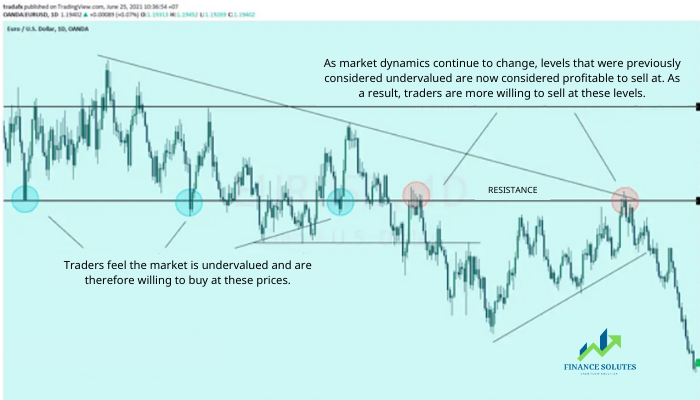
Therefore, we can consider support and resistance levels as price points in the market where traders are more willing to buy or sell, depending on market conditions. This creates a zone of tension between buyers and sellers, often causing the market to reverse.
Below is a chart illustrating this concept:
Next, let’s explore how to accurately identify them.
2. HOW TO IDENTIFY SUPPORT AND RESISTANCE ZONES
There are two common ways to identify support and resistance zones:
– Horizontal levels at the highest/lowest prices
– Using trend lines connecting peaks and troughs
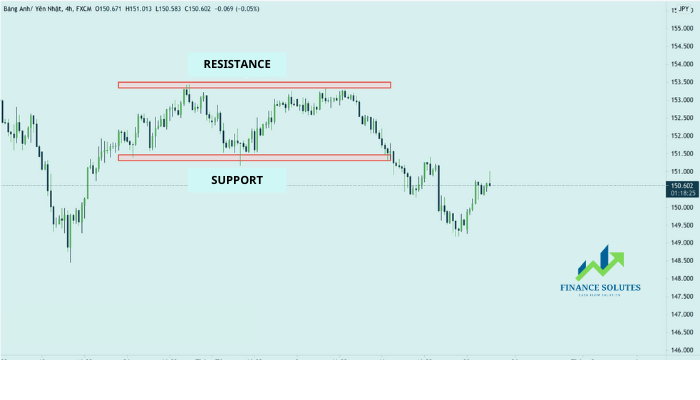
When multiple peaks or troughs (or both) align horizontally on the chart (or occur at the same price level), we can identify support or resistance zones by drawing a horizontal line at this level.
Let’s look at the example below:
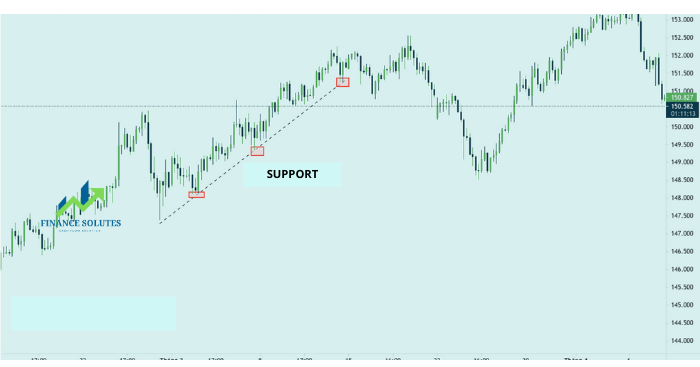
Not always do prices form horizontal peaks and troughs. They can slope upward or downward according to market mechanisms. When prices consistently form higher highs and higher lows, we can use a trend line to connect them, and vice versa.
Let’s take a look at the example below:
If the support level is the threshold where the price does not fall below, then the resistance level is where the price has struggled to rise in the past. Think of support as the floor and resistance as the ceiling.
3. HOW TO DRAW SUPPORT AND RESISTANCE
3.1. Choose the chart where you want to identify support and resistance
This is the first step, and it is as simple as the title suggests. Remember, do not overcomplicate things in trading. Simplicity is sometimes better. The only thing you need to do is open any chart and choose the type of chart you prefer.
When preparing to draw support and resistance on a chart, switch to a higher time frame such as the weekly or monthly chart.
3.2. Identify all swing highs and swing lows
After opening the chart, you should mark the swing highs and swing lows on the chart. You can scroll the price forward a bit, but not too far.
Take a look at the chart below:
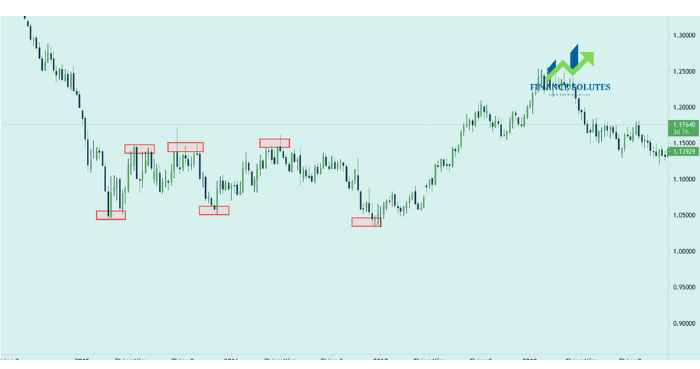
The strength of this step is that you can determine whether the market is trending because you can see if the highs and lows are gradually rising, falling, or moving within a range.
As shown in the example chart above, the market is in a range, with no clear trend.
3.3. Connect the highs and lows identified in step 2
The final step in drawing support and resistance zones involves connecting the highs and lows you identified with straight lines. These will become your key support and resistance zones.
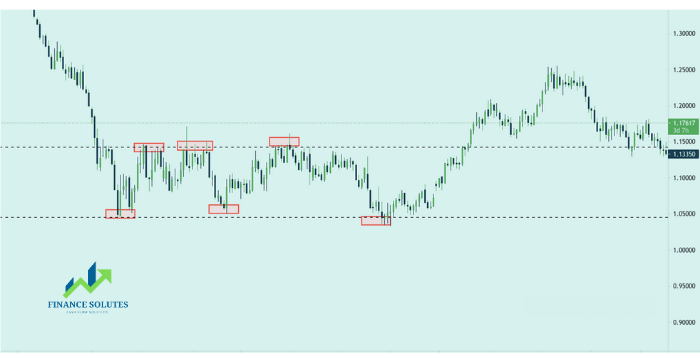
Almost all the highs and lows identified will not lie exactly on a straight line. This is completely normal.
Once you have completed this process, you can be confident that the lines represent clear support and resistance zones. You can always adjust your support and resistance lines, but in reality, this is not necessary.
4. COMBINING SUPPORT AND RESISTANCE WITH SUPPLY AND DEMAND ZONES
Support and resistance levels and supply and demand zones are closely related. Both identify points in the market where price is likely to reverse, and both can be found forming across all charts.
4.1. Similarities and Differences Between Support & Resistance and Supply & Demand Zones
Supply and demand zones and support and resistance levels share many similarities, which can cause confusion among traders. Some traders are not even aware of the concept of supply and demand zones, making it easier to mix them up.
The key difference between the two is that supply and demand zones provide an area that you can use to look for entry points, whereas support and resistance levels are simply lines that you can observe when making trading decisions.
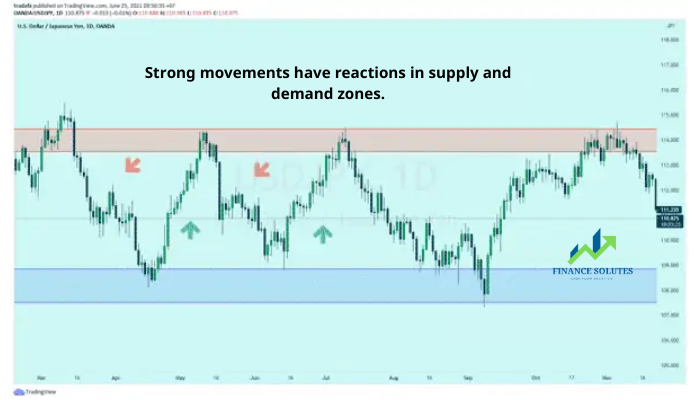
In summary, all initial support and resistance levels originate from supply and demand levels, where the price has been tested and confirmed several times to fill previously unexecuted orders.
After the price has been validated at these levels multiple times, supply or demand turns into support and resistance.
4.2. Using Support and Resistance in Supply and Demand Trading
Supply and demand zones are considered advanced knowledge in forex trading. Therefore, for new forex traders, Finance Solutes does not recommend using this method for trading.
The first step in trading supply and demand using support and resistance lines is to: Identify support and resistance levels within the supply and demand zones.
This can be easily done by marking the zones on your chart first, then identifying the support and resistance lines within those zones.
Once you’ve accurately marked the support and resistance levels, as well as the supply and demand zones, you should start observing price levels for potential entry points into trading positions.
The best way to do this is to switch to a lower time frame. Then, observe the price action that forms as the market starts to interact with each price level within the zone.
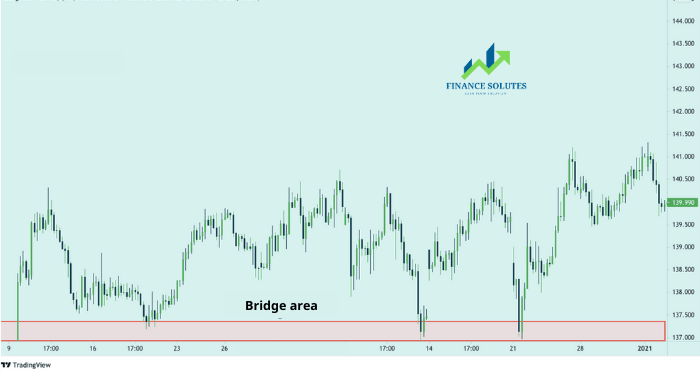
You can watch for candlestick patterns like engulfing candles when the market touches support or resistance levels. If such patterns appear, they can signal a slight price increase or decrease.
A useful tip when trading support and resistance levels within supply and demand zones is to monitor multiple price fluctuations forming around similar high or low levels before entering your trade.
Almost every market reversal, regardless of the time frame, will have at least two price swings forming with their highs or lows ending near similar price levels before the reversal occurs.
Finally, when you have entered a profitable trade; the market has reversed out of the supply or demand zone. The actual point of taking profit depends on the trader’s personal goals. However, the best time to take profit is after you see the market making a new high; if you have a buy trade; or after a new low if you have a sell trade.
5. 3 COMMON SUPPORT & RESISTANCE TRADING STRATEGIES
Here are the top 3 strategies for trading with support and resistance zones in forex:
5.1. Range Trading
The idea behind range trading is to buy near support and sell near resistance. In this approach, traders treat support as the floor and resistance as the ceiling. This strategy is mainly used when the price is moving sideways without a clear trend.
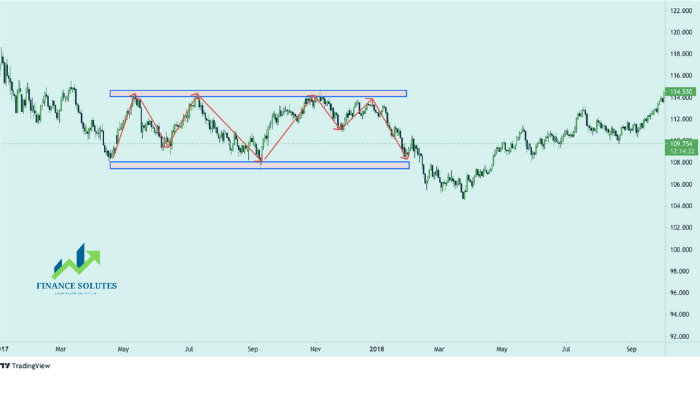
Buying near support or selling near resistance can be effective, but there’s no guarantee that these levels will hold. Therefore, traders should wait for confirmation signals to ensure the price respects those zones.
If you’re buying near a support zone, wait for price accumulation within that support area. Then, enter a buy trade when the price breaks above the high of the small accumulation zone. This movement signals that the price is respecting the support level and starting to rise.
The same principle applies to selling near resistance zones. Wait for the price to accumulate near resistance and enter a short trade when the price drops below the low of that small accumulation zone.
If buying near support, consider exiting just before the price hits strong resistance. If selling at resistance, consider exiting just before the price hits strong support.
5.2. Breakout Trading
After a period of time and the price fluctuates below the resistance level, it will break this resistance level. As in the USD/JPY chart example below. The price broke the resistance line. And then the resistance line became the support line. Regarding the term of switching the roles of support and resistance, Finance Solutes has talked about this in the previous article.
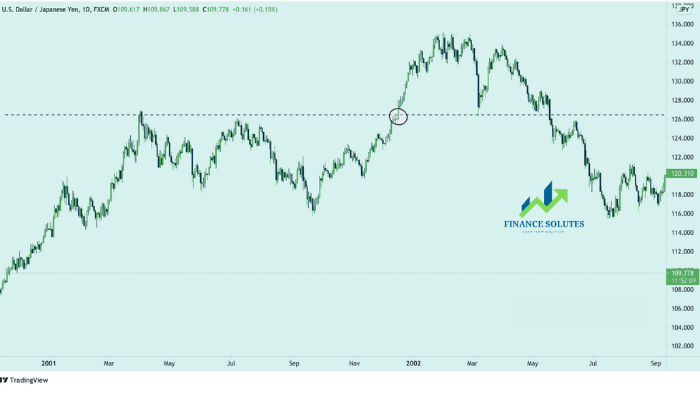
And sometimes, false breakouts can occur. So how can you distinguish between a true breakout and a fake one, helping you avoid market traps?
First, traders tend to wait for a pullback. As shown in the previous example, to be more certain, traders wait for the price to pull back to the old support level, which now acts as the new resistance. In this case, it’s best to wait for the market to continue its upward movement after the pullback before looking for entry points.
There are also some rules, you can read more about them. That is, support and resistance tend to break when the price has been consolidating for a while. Support zones are areas with potential buying pressure. Conversely, sell zones are areas with potential selling pressure. What happens when the price does not increase or decrease in a trend at that zone; but instead, it consolidates?
Let’s go back to the first part about things you must know about support and resistance. The more times a support or resistance level is tested; the weaker it becomes. So it is a sign of weakness when the bulls cannot push the price higher; or the bears cannot push the price lower.
5.3. Trendline Trading Strategy
Support and resistance can also be marked by trendlines — diagonal lines that show the general market direction.
In an uptrend, the price forms higher highs and higher lows. In a downtrend, the price creates lower highs and lower lows. Connect these swing highs and swing lows to draw the trendline. Then, extend that line to the right to identify future support or resistance levels.
These simple lines help highlight trends and price ranges. They provide traders with a visual guide to understand price movements and anticipate what the market might do next.
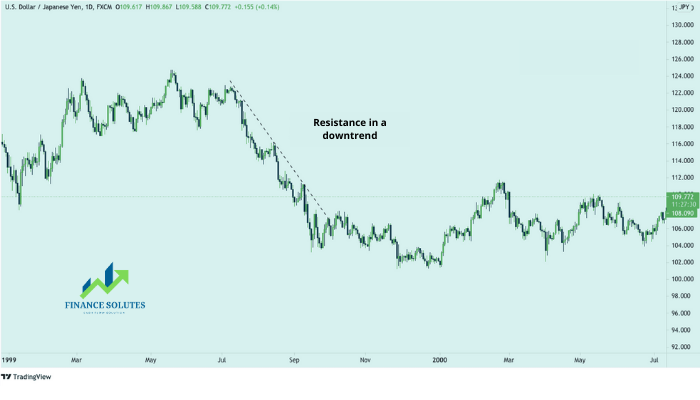
When the price is in a strong trend, it often bounces off the trendline. Then, it continues moving in the ongoing trend. Therefore, traders should only look for entry points; opportunities to trade in line with the trend. For example, as shown in the example above, the price is in a strong downtrend; you should only look for selling entry points.
6. THE KEY TO SUPPORT AND RESISTANCE TRADING
Support/resistance is an important key in trading. Most strategies incorporate some form of support/resistance (S/R) analysis.
Support/resistance trading strategies can be based on price reacting to these levels (zone trading strategies) or predicting the breakout of support/resistance levels (Breakout and pullback strategies).
Price will not be confined by support/resistance levels forever. Keeping this in mind helps apply capital and account burn risk management appropriately, limiting losses in case of a breakout.
6.1. Using Swing Highs and Swing Lows
By using swing highs and swing lows as guides to start drawing support and resistance levels, you are more likely to capture “key price levels.” High-probability trade signals often appear at these levels.
Don’t worry if swing highs and swing lows don’t align perfectly.
Remember that most price levels will not align perfectly with highs and lows. Instead of worrying about that, you should spend time ensuring that the levels capture the most price touches from both opposing directions.
6.2. Focus on Key Market Price Levels
These are the clearest support and resistance levels and should be immediately noticeable. If you have to spend too much time and effort finding a price level, it probably isn’t worth considering as support or resistance on your chart. By focusing only on key price levels, you’ll be in a much better place to trade price action signals when they appear.
7. SOME IMPORTANT NOTES
The more times the price touches a level, the more important that level becomes. A price level that the market respects and reacts to acts as good support/resistance. Use this as one of the factors when drawing support and resistance levels.
The longer a barrier holds, the more significant it becomes when the price breaks that barrier. Similarly to the above idea, when a support or resistance level holds the market for a long time, it carries significant importance. The market respects it. When it breaks, it signals a major shift in sentiment and serves as a great trade location.
The more times the price tests a barrier, the weaker that barrier becomes.
Barriers that previously acted as support/resistance are ideal trading locations. This was explained in the previous article about the role reversal of these two levels.
Finally, focus on recent price action. Many traders like to zoom their charts out very far to find support and resistance. However, recent price action best describes the current market trend. You should prioritize swing points that create support/resistance zones within the past few days to weeks. Don’t go back years just to draw support and resistance zones.
8. SUMMARY
Hopefully, through this article, you have understood the concept of resistance and support. Additionally, you now know how to identify support and resistance zones.
Remember not to overcomplicate things. Drawing support and resistance levels should be one of the easiest and most comfortable things to do. Simplify it and, most importantly, trust in your abilities! You can double-check, but remember that your first drawing is often the most appropriate in forex trading.
Wishing you success in your trading career!!!
- t.me/finance_solutes
- Website: https://finance-solutes.com
- Hotline: +1 929 5636 439 ( Hotline )
- 26 Broadway, Suite 934, New York, 10004, US
