
 XM
XM Bybit
Bybit Binance
 Robinhood
 Webull
 IC Markets
 Pepperstone
 OKX
OKX Vantage
 VT Markets
 BingX
BingX Gate.io
 Kucoin
 MEXC
MEXC Exness
 Bitget
Parabolic SAR Indicator in Stock and Forex Trading. The Parabolic SAR is a popular indicator used to determine the end of recent trends in Forex trading. However, not all traders are familiar with its history and how to use this technical tool.
What is the Parabolic SAR indicator? How can traders use it in Forex trading? How is the Parabolic SAR applied in stock trading? Let’s explore these questions in today’s article!
WHAT IS THE PARABOLIC SAR INDICATOR?
The Parabolic SAR is a technical indicator developed by John Welles Wilder with three main objectives:
- Highlighting the current market trend
- Predicting trend reversals
- Providing potential entry and exit signals
In addition to the Parabolic SAR, J. Welles Wilder is also known for the success of other indicators, such as the Relative Strength Index (RSI), the Average Directional Index (ADX), and the Average True Range (ATR).

SAR stands for “Stop And Reverse,” which is why it is also considered a system of stop points and reversals. Traders often use this indicator to identify buy and sell signals for current trends and determine the right moments to enter and exit trades based on market momentum.
- The Parabolic SAR (Parabolic Stop and Reverse) indicator is used by technical traders to detect trends and trend reversals. This indicator tends to work well in trending markets but generates many false signals and losing trades when the price starts to move sideways.
1.1. Meaning of the Parabolic SAR Indicator
The Parabolic SAR appears on the chart as a series of small dots placed near price bars or candlesticks. The dots appear above the price when the market is in a downtrend. Conversely, the Parabolic SAR appears below the price bars when the market is in an uptrend.
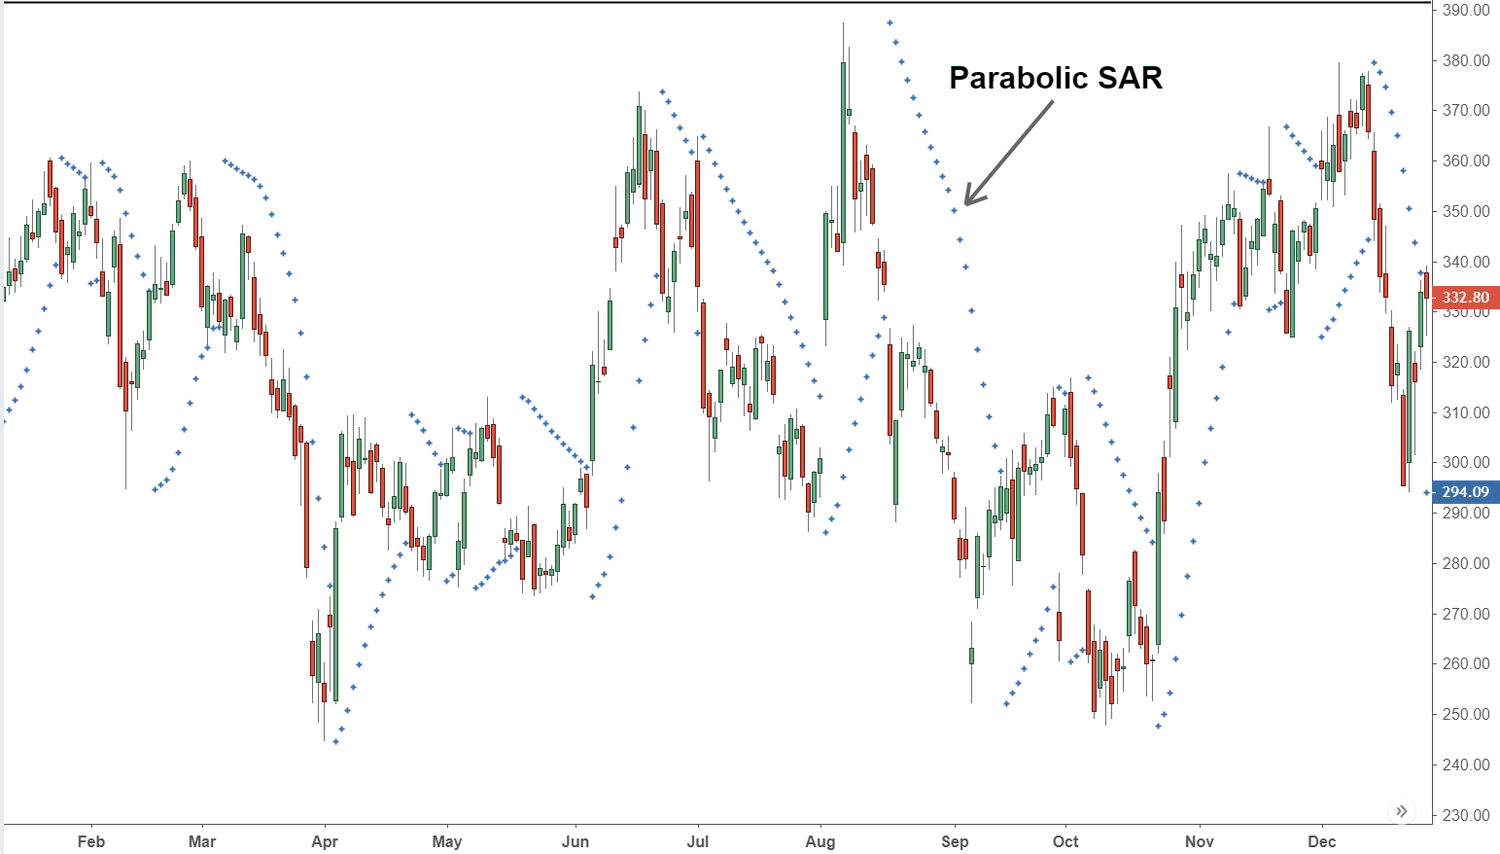
When you see the Parabolic SAR dots flipping up or down, it indicates a potential change in price direction.
The dots appearing above the price bars suggest that the bears are in control, and the momentum is likely to continue downward. Conversely, when the dots appear below the price bars, it illustrates that the bulls are in control of the market.
1.2. Parabolic SAR Formula
The Parabolic SAR indicator uses the highest and lowest price values along with an acceleration factor to determine where the Parabolic SAR will appear.
General Formula for Parabolic SAR (PSAR):
Next PSAR = Current PSAR + AF (EP – Current PSAR)
Where:
- EP: Extreme Point (the highest point of an uptrend or the lowest point of a downtrend)
- AF: Acceleration Factor (The default value in most platforms is 0.02. This value increases by 0.02 each time a new EP is recorded, but it has an upper limit of 0.2)
Formula for Parabolic SAR in different market trends:
- Uptrend:
Next PSAR = Current PSAR + AF (EP – Current PSAR) - Downtrend:
Next PSAR = Current PSAR + AF (Current PSAR – EP)
2. How to Use Parabolic SAR in Stock and Forex Trading
2.1. How to Apply the Parabolic SAR Indicator in MT4 and TradingView
To apply the Parabolic SAR in MT4:
- Open the MT4 interface
- Click on Insert in the menu bar
- Select Indicators
- Choose Trend
- Select Parabolic SAR (see the image below)
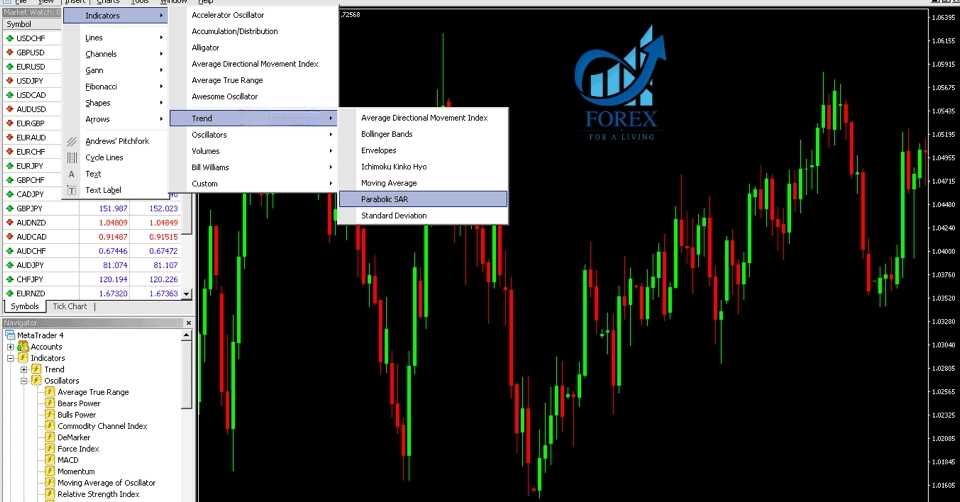
After making your selection, a settings window will appear in MT4:
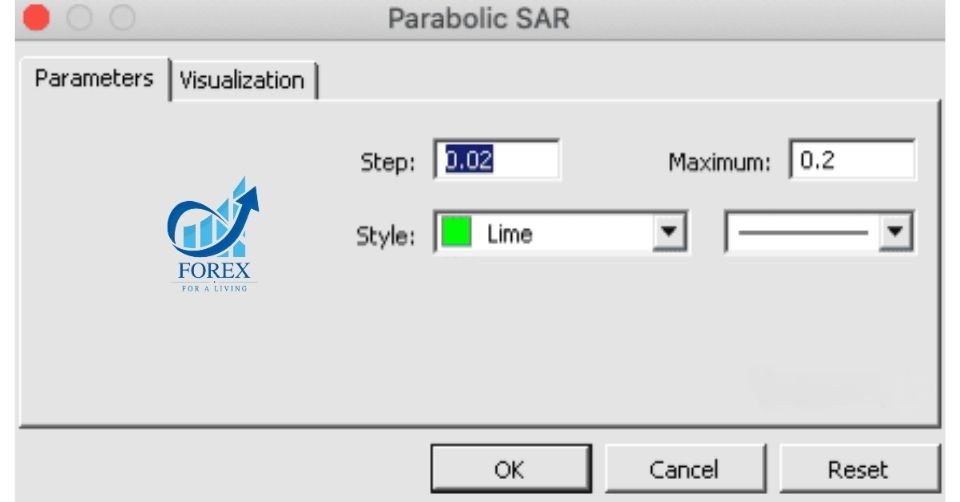
What is the Parabolic SAR Indicator? How to Use PSAR in Detail
You can customize the display color or the style of the Parabolic SAR indicator. For other settings, TradaFX recommends keeping the default values unchanged.
After clicking “OK,” your chart will look like this:
For Parabolic SAR on TradingView, follow these steps:
- Select a currency pair
- Go to the Indicators tab
- Type “Par” into the search bar
- Select either the “Parabolik SAR” (Vietnamese version) or “Parabolic SAR” (English version)
2.2. Breakout Strategy
Parabolic SAR is a technical indicator that continuously provides breakout signals. As mentioned earlier, whenever the Parabolic SAR line flips either above or below the price, it indicates that a trend reversal or a potential breakout is imminent.
Therefore, one of the top ways to use the Parabolic SAR is in a breakout strategy. More specifically, you can wait for the Parabolic SAR trading signal to follow a new direction after a pullback.
Let’s analyze the example of Apple stock chart below:
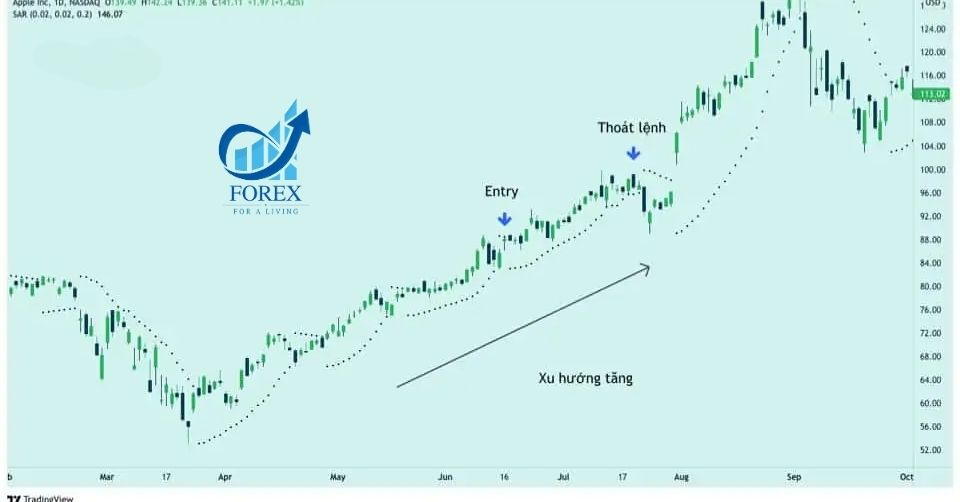
In the chart above, the price is in a long-term uptrend. The starting point of the Parabolic SAR line below the price marks entry points, and when the line flips above the price, it signals the end of the trend.
Traders can enter a buy position when the price moves above the Parabolic SAR line while the overall trend is bullish.
The opposite is true for a downtrend. The Parabolic SAR works best in trending markets.
The position of the Parabolic SAR line flipping above or below can be used as a stop-loss point. However, sometimes the Parabolic SAR line can shift quite far from the starting point of the trend.
In such cases, you should consider placing your stop-loss below the nearest swing high if entering a sell trade, or vice versa. A stop-loss placed about 2 pips away is usually sufficient.
2.3. Combining Parabolic SAR with Other Indicators
In trading, it’s better to combine one indicator with another to confirm a specific signal rather than relying on just one indicator.
Here, you can combine the Parabolic SAR with a moving average.
The slope of the moving average reflects the strength or weakness of the trend. The crossover of two moving averages can also help traders detect trend reversal signals in the market.
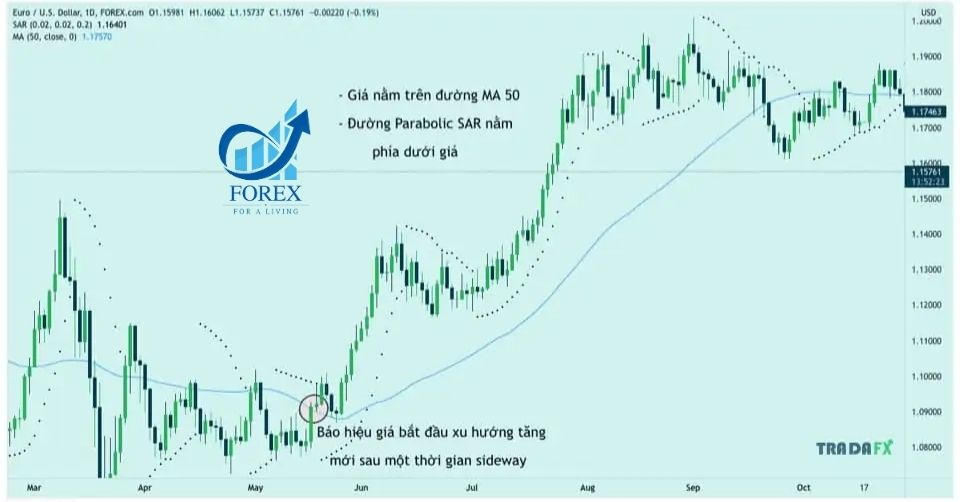
In the EUR/USD chart above, you can see the combination of the Parabolic SAR indicator and the moving average.
When the price is above the moving average, it indicates that the buyers are in control of the direction. In this case, focus on buy signals. The SAR indicator here is used to set stop-loss points.
3. Advantages and Disadvantages of the Parabolic SAR Indicator
| Advantages | Disadvantages |
|---|---|
| – Helps identify the direction of price action | – Tends to give false signals in sideways markets |
| – Provides good signals in trending markets | |
| – Indicates exit points when a trend reversal may occur |
4. Conclusion
The Parabolic SAR is not a perfect indicator to rely solely on for trading signals.
However, it can be an excellent tool for determining trends and maximizing your risk:reward ratio.
The creator of this indicator, J. Welles Wilder, also recommended that traders first identify the trend using the Parabolic SAR and then combine it with other indicators to gauge the strength of the trend.
No matter how you combine indicators, don’t forget to set a stop-loss and have a solid risk management strategy in place.
- t.me/finance_solutes
- Website: https://finance-solutes.com
- Hotline: +1 929 5636 439 ( Hotline )
- 26 Broadway, Suite 934, New York, 10004, US
