
 XM
XM Bybit
Bybit Binance
 Robinhood
 Webull
 IC Markets
 Pepperstone
 OKX
OKX Vantage
 VT Markets
 BingX
BingX Gate.io
 Kucoin
 MEXC
MEXC Exness
 Bitget
Zig Zag Indicator: Unveiling the “Secret” Indicator Behind Trend Confirmation – The Zig Zag Indicator is one of the most powerful tools for detecting trends and confirming potential reversals. So, how is the Zig Zag Indicator formula calculated, and how can it be applied effectively?
The Zig Zag Indicator is no stranger to technical analysis. However, it is often underappreciated despite being a highly effective tool for trend detection and confirming potential reversals.
So, what exactly is the Zig Zag line? How can the Zig Zag indicator be used in forex trading? Let’s explore the answers to these questions in today’s article!
1. What is the Zig Zag Line?
The Zig Zag indicator is a technical analysis tool used to identify price patterns in trading.
It is designed to highlight trends and confirm potential reversals. This is why TradaFX refers to the Zig Zag indicator as the “trend-confirming indicator.”
It is called the Zig Zag indicator because it forms a shape resembling the zig-zag pattern.
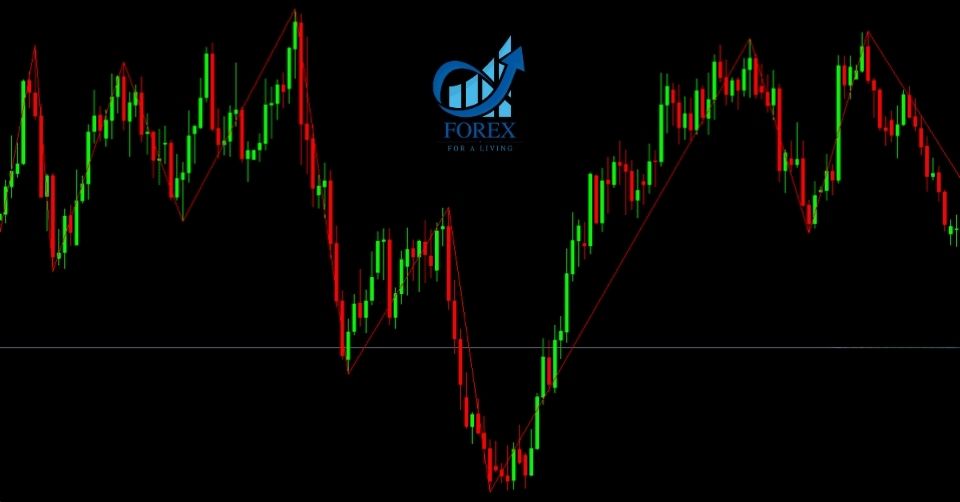
The Zigzag indicator helps minimize noise in the market to highlight the underlying trends.
This type of indicator works best in markets with strong trends.
1.1. The Meaning of the Zigzag Line
The Zigzag indicator is a versatile tool with a relatively simple approach. If you’ve been trading in the forex market for a while, you’re likely aware that prices rarely move in a straight line; they continuously fluctuate.
This indicator works on the principle of ignoring minor price fluctuations and only focuses on connecting significant highs and lows on the chart.
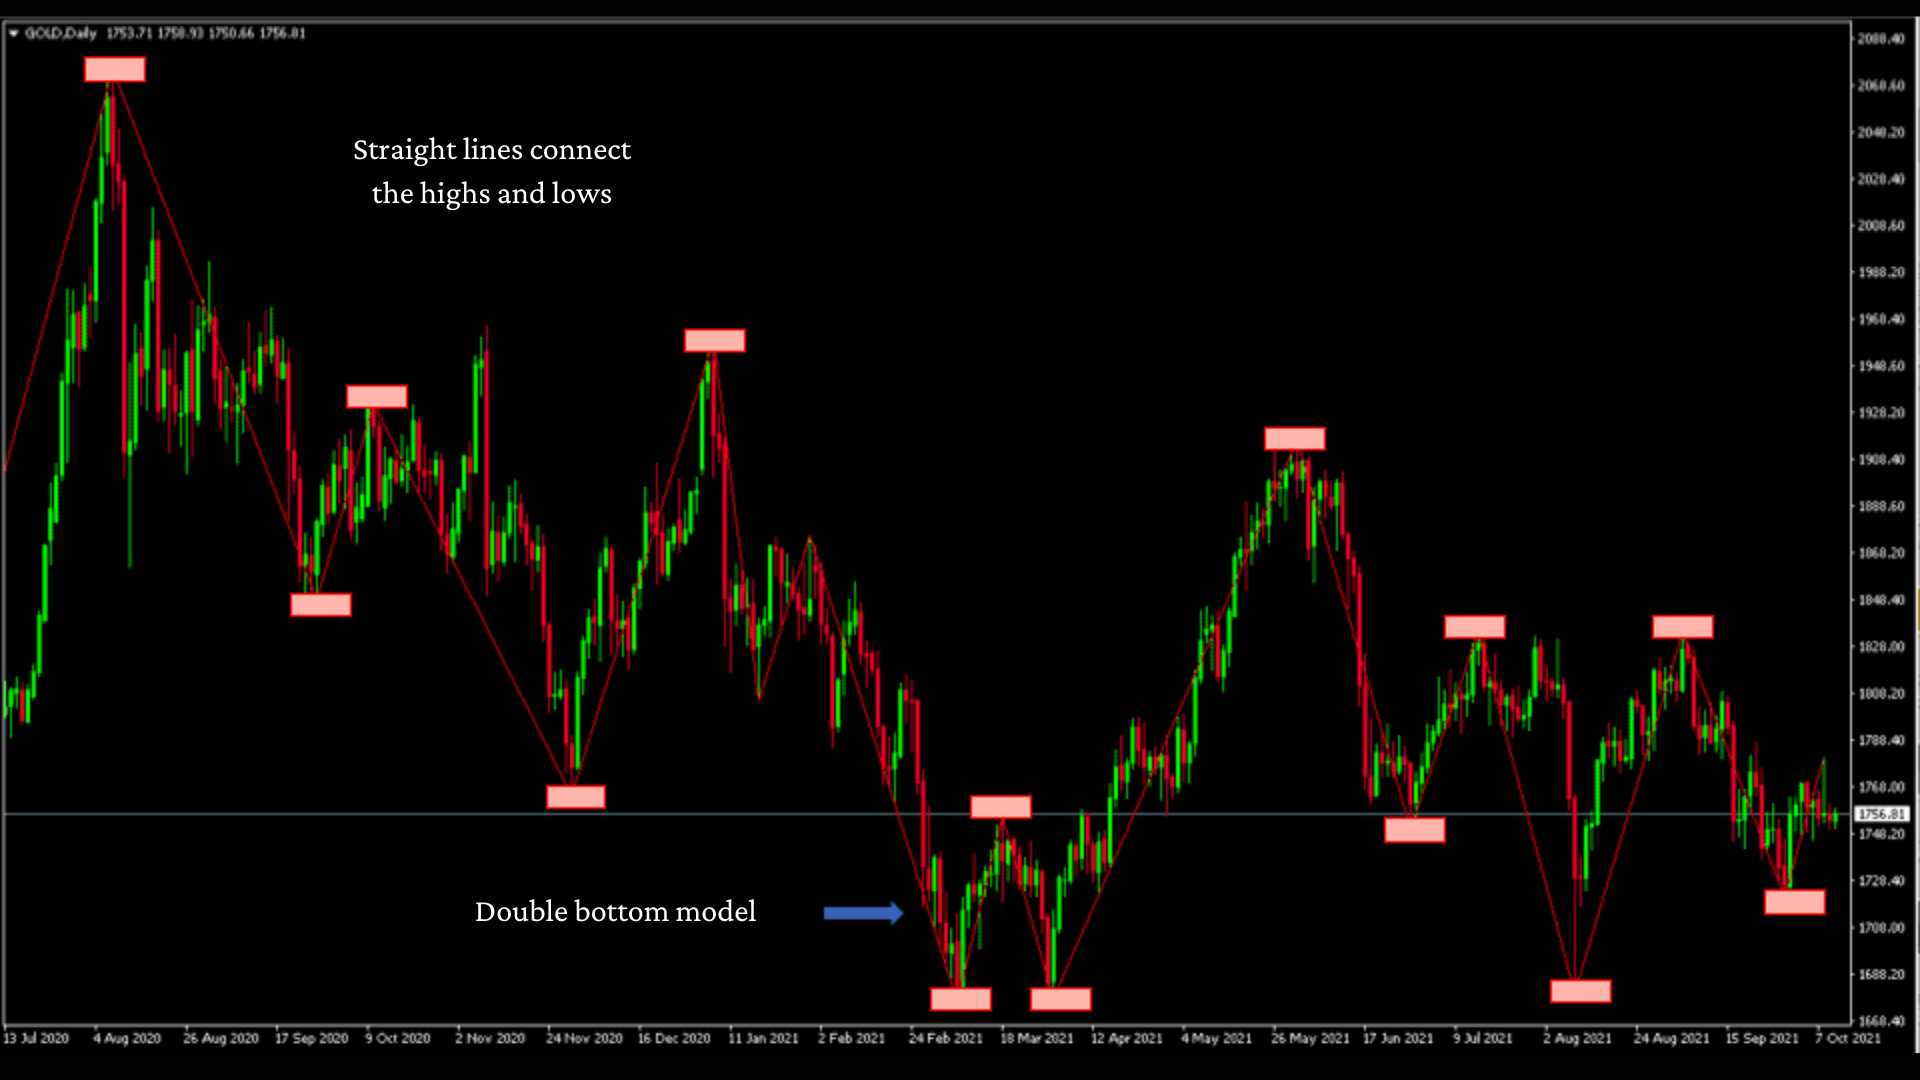
At the same time, traders can easily spot price patterns.
The way the Zigzag indicator works allows traders to track important market movements without being distracted by insignificant small fluctuations.
1.2. How are Zigzag Indicators Calculated?
The Zigzag indicator is calculated by placing symbolic points on the chart whenever the price reverses by a predetermined amount. Straight lines are then drawn to connect these symbolic points.
1.3. Setting Up Zigzag on MT4
Setting up the Zigzag indicator on the MT4 platform is extremely easy.
First, open the MT4 software -> Click on Insert in the menu bar -> Select Indicators -> Scroll down to the bottom and choose Custom -> Finally, select Zigzag at the end of the list.
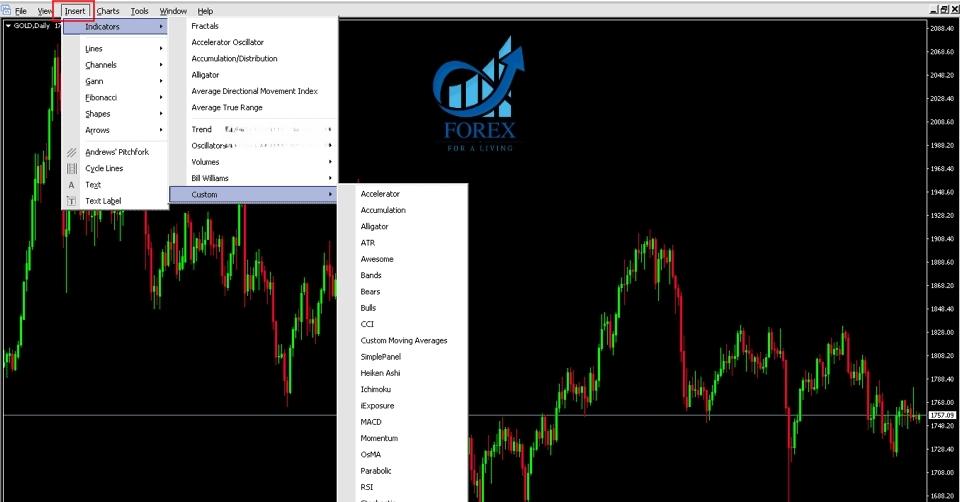
After making your selection, a dialog box will appear, allowing traders to modify the color settings, timeframes displayed, and more. If you don’t wish to change anything, you can simply click OK.
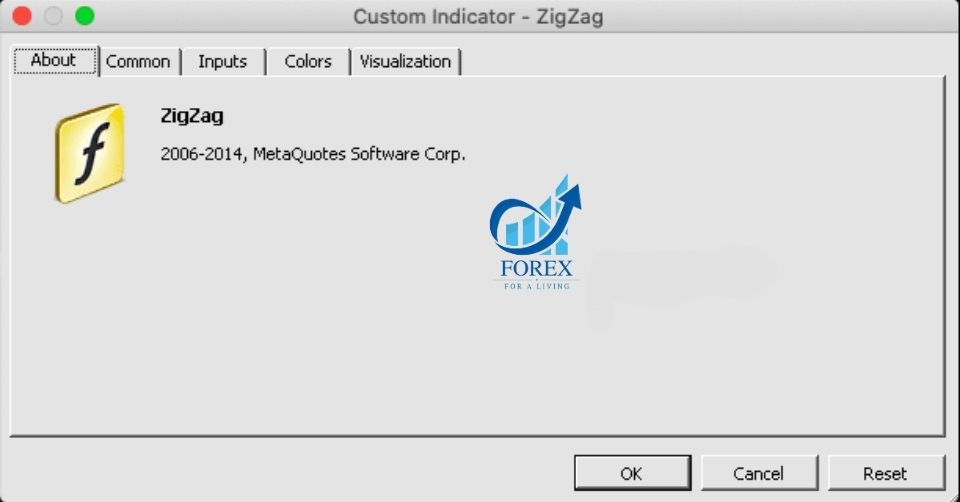
Zigzag Indicator – A Simple Trend Identification Tool
In the Inputs tab, you will find the settings for Depth, Deviation (Deviation), and Backstep.
- Depth refers to the percentage change when the trend reverses. For example, if the price drops by 5% from the previous high, the Zigzag indicator will display a red downward line, indicating that the market trend has changed.
However, if your trading platform does not have the Zigzag Indicator integrated, you can download the Zigzag indicator for free below:
Download
2. ZIGZAG STRATEGY IN FOREX TRADING
Let’s take a look at the following example chart:
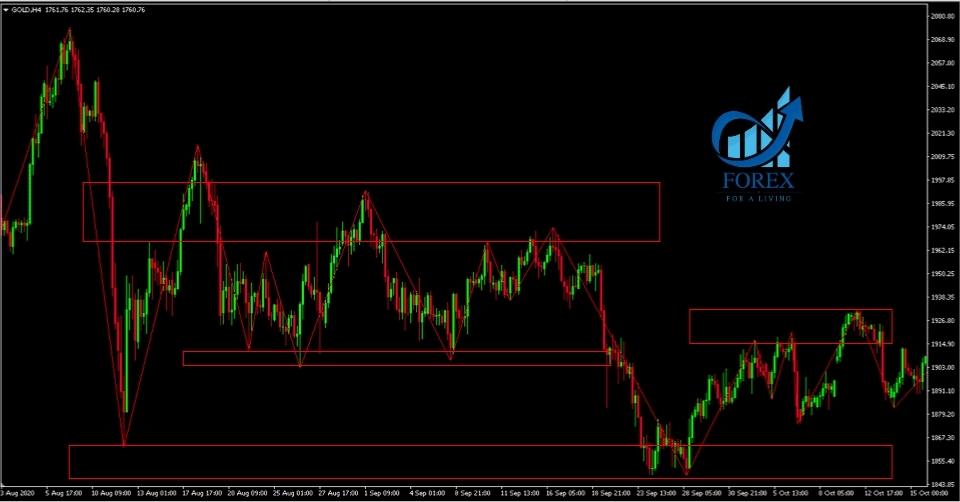
In the chart, the price zones are marked with red rectangular boxes. These are the price areas where the Zigzag indicator tends to reverse direction when it reaches them.
This gives us potential support and resistance zones. When the Zigzag indicator approaches these levels, it can forecast future price movements, as you can observe price reversals occurring multiple times within these areas. From there, the strength or weakness of these support and resistance levels can be validated.
One of the best Zigzag strategies is to wait for candlestick patterns to appear within these price zones.
Although this isn’t a foolproof strategy, it provides you with an idea of the probability that a candlestick pattern will form in a direction favorable to your trade.
2.1. Zigzag Tool Supporting Elliott Wave Theory Strategy
Many trading strategies are built on the concept of trying to capture and follow a short-term trend. However, sometimes trading against the trend can be more profitable.
That being said, trading against the trend is not recommended for new traders, as they might not yet have the knowledge to avoid market traps.
According to market structure, price often experiences a pullback or correction phase. Traders can take advantage of short-term moves during this period.
This is why the Zigzag indicator is often used in conjunction with Elliott Wave theory.
Ralph Nelson Elliott, who developed Elliott Wave Theory, posited that markets are structured in two phases—motive waves (impulse waves) and corrective waves.
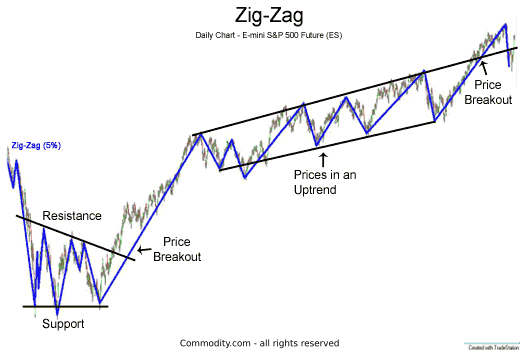
Elliott believed that market movements are driven by market psychology. As mentioned in the article on Elliott Wave Theory, the biggest challenge in using this theory is determining where the waves begin and end.
This is where the Zigzag indicator can be extremely helpful. The Zigzag indicator is often used alongside Elliott Wave Theory to identify the position of each wave within the overall cycle. It can be particularly useful in identifying the zigzag pattern during corrective waves.
2.2. Using Zigzag Indicator with Fibonacci Retracement
Another powerful combination that traders can’t overlook is pairing the Zigzag indicator with Fibonacci retracement levels.
In the example chart below for GBP/USD on the H4 timeframe, Fibonacci retracement levels are drawn in alignment with one of the Zigzag lines.
The Fibonacci retracement tool is often used to identify potential support and resistance levels during a trend correction, and when combined with the Zigzag indicator, it can provide even more confirmation of price reversal zones.
By using these two tools together, traders can better pinpoint entry and exit points, especially when the market shows signs of retracing before continuing its primary trend.
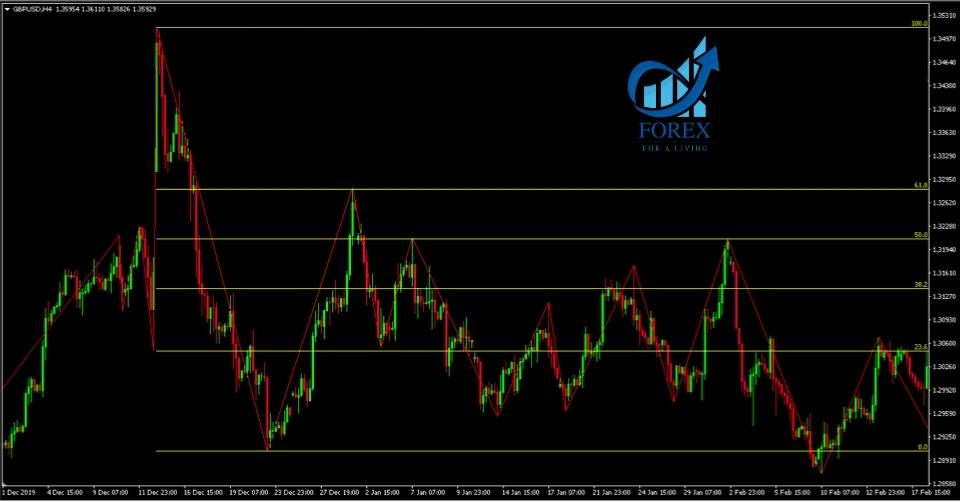
The basic idea behind combining the Zigzag indicator with Fibonacci retracement levels is that important Fibonacci levels represent potential reversal points where price may approach and turn around.
Adding the Zigzag indicator helps identify the points where price increases and decreases have occurred, as well as where they started and ended.
The Zigzag indicator eliminates minor, insignificant fluctuations and market noise, making it highly effective in identifying key pivot points.
3. Advantages and Limitations of the Zigzag Indicator
The Zigzag indicator is commonly used to analyze market trends, with trend lines connecting significant pivot points.
As a result, the Zigzag tool plays a significant role in evaluating and analyzing Forex charts. Like other technical indicators, it has its advantages and limitations that traders should be aware of.
| Advantages | Limitations |
|---|---|
| Can identify the dominant market trend | Relies on past price data to generate signals |
| Eliminates insignificant fluctuations that cause market noise | Works inefficiently in sideways markets |
| Provides a comprehensive view of market price movement | |
| A flexible and useful technical indicator |
4. Conclusion
The Zigzag indicator does not directly generate trade signals. The most effective use of the Zigzag indicator is to analyze long-term market trends.
It can also be used as a supporting tool in combination with other trading indicators.
With its simplicity and effectiveness, the Zigzag indicator is definitely a technical tool worth experimenting with.
- t.me/finance_solutes
- Website: https://finance-solutes.com
- Hotline: +1 929 5636 439 ( Hotline )
- 26 Broadway, Suite 934, New York, 10004, US
