
 XM
XM Bybit
Bybit Binance
 Robinhood
 Webull
 IC Markets
 Pepperstone
 OKX
OKX Vantage
 VT Markets
 BingX
BingX Gate.io
 Kucoin
 MEXC
MEXC Exness
 Bitget
Trading Strategy with Bollinger Bands and MACD – Bollinger Bands and MACD are among the most widely used indicators in the Forex market. While they are effective on their own, their true power is realized when combined. Together, they provide traders with deep insights into both market volatility and momentum.
Bollinger Bands can give useful signals for technical traders, and when combined with MACD, they provide a comprehensive view of both market volatility and momentum.
1. Trading Strategy – Combining Bollinger Bands and MACD
As the title suggests, traders can combine Bollinger Bands and MACD to assist with trade setups. Bollinger Bands allow traders to assess the cyclical nature of volatility, while the MACD indicator is an effective momentum trend indicator.
Using both indicators together can support traders in making higher probability trades, as they can evaluate both the direction and strength of the current trend along with volatility. Therefore, traders can use MACD to assess whether a trend is strengthening or slowing down, helping set up for a potential breakout, while Bollinger Bands can be used as a trigger for entry and confirmation of the trade.
2. Trading Strategy when Combining Bollinger Bands and MACD
Traders can trade with the combination of Bollinger Bands and MACD in several ways. However, two of the most popular approaches involve trading Breakouts and trading Trend-following.
2.1. Bollinger Band Breakout Trading Strategy
Traders wishing to trade a Bollinger Band Breakout can consider the following steps:
- Identify the trend direction using the MACD indicator.
- Look for divergence in the MACD chart (signaling potential breakout).
- Find entry points when the price breaks through the MA20 or a trendline.
- Confirm the breakout through the breaking of the Bollinger Bands, accompanied by an increase in volatility (Bollinger Bands widening) and rising momentum (longer MACD bars).
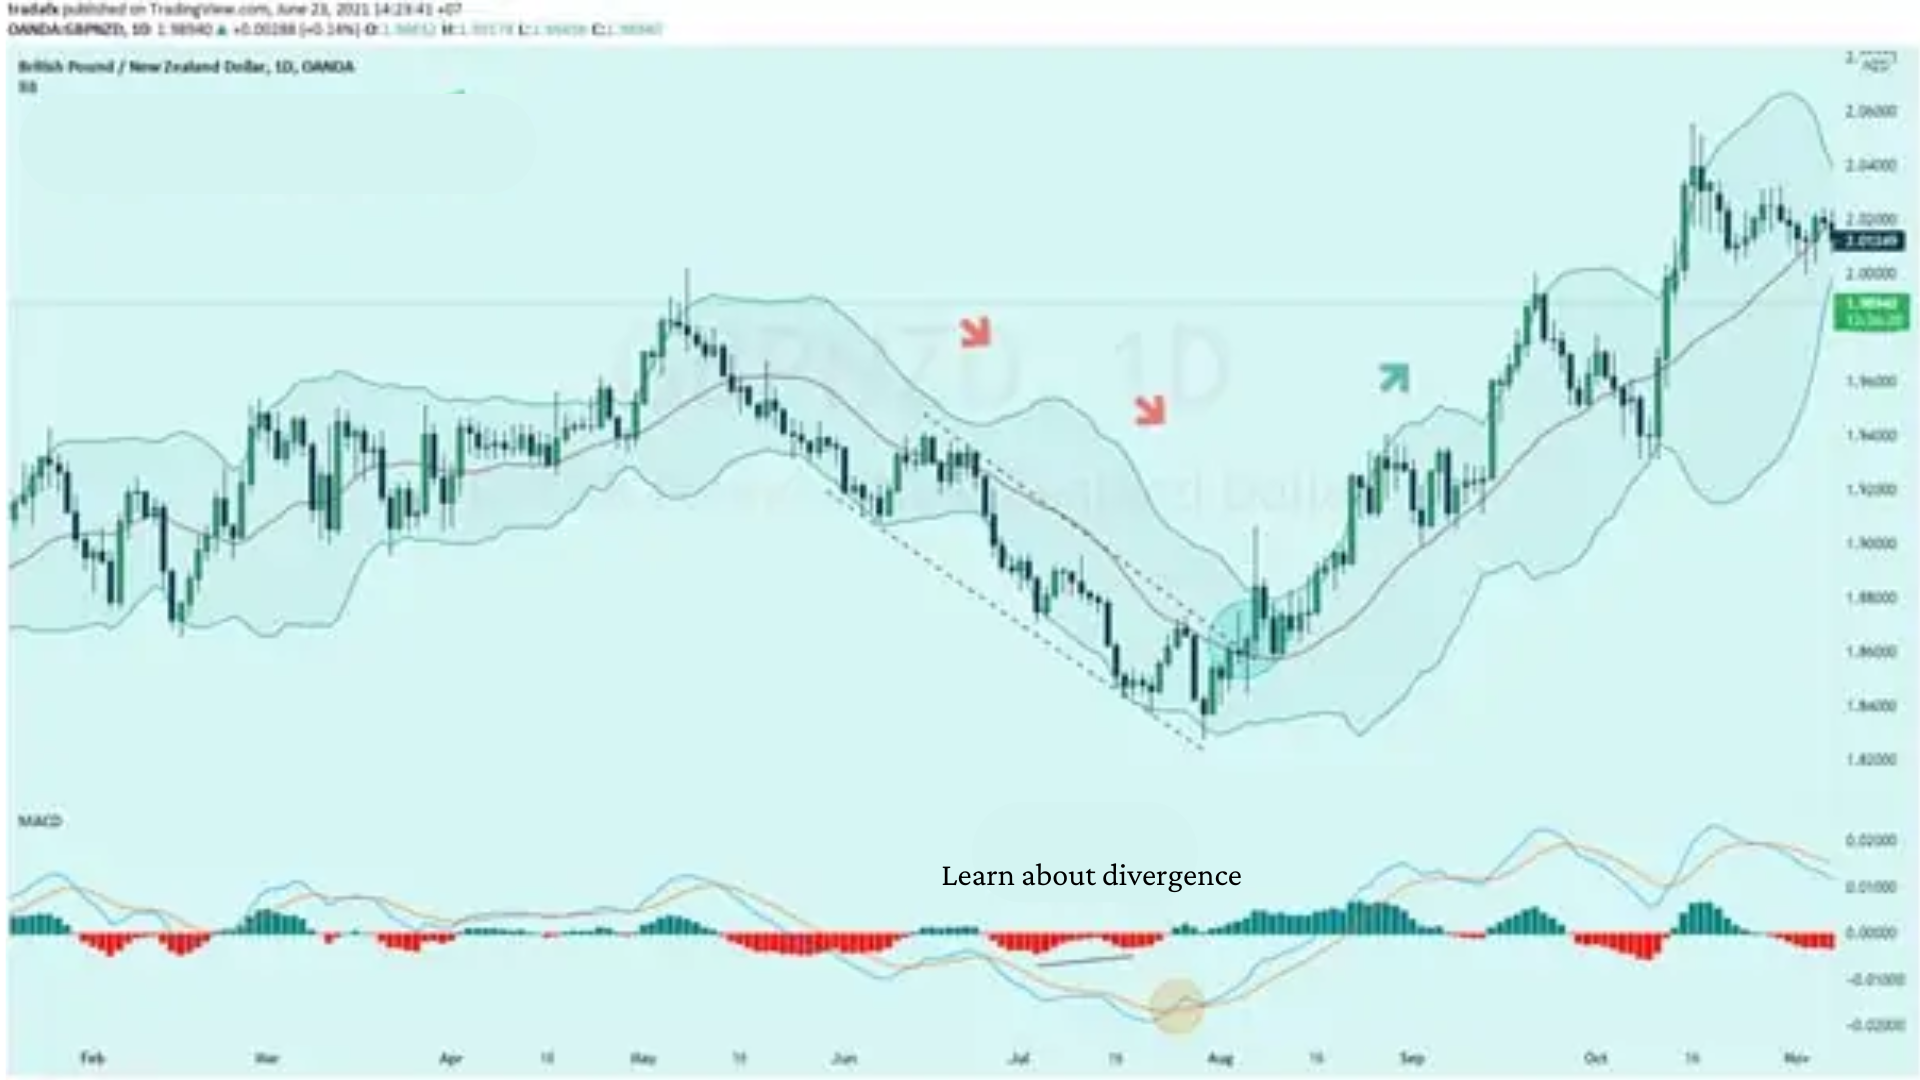
In the GBP/NZD pair chart below, a strong downtrend is clearly visible as the price starts to trade within a descending channel. Traders can trade the breakout by looking for slowing downward momentum (divergence in the MACD chart).
2.2. Trading Strategy – Trend-following Strategy with Bollinger Bands and MACD
Combining Bollinger Bands and MACD can also be highly effective in trending markets. Here’s how traders can use them together for trend-following trades:
- Identify the trend using the MACD indicator.
- Use bounces from the MA20 (middle line of the Bollinger Bands) as potential entry points (aligned with the trend).
- Look at the MACD to confirm the continuation of the trend momentum.
- Use the lower (or upper) band as a stop-loss level in an uptrend (downtrend).
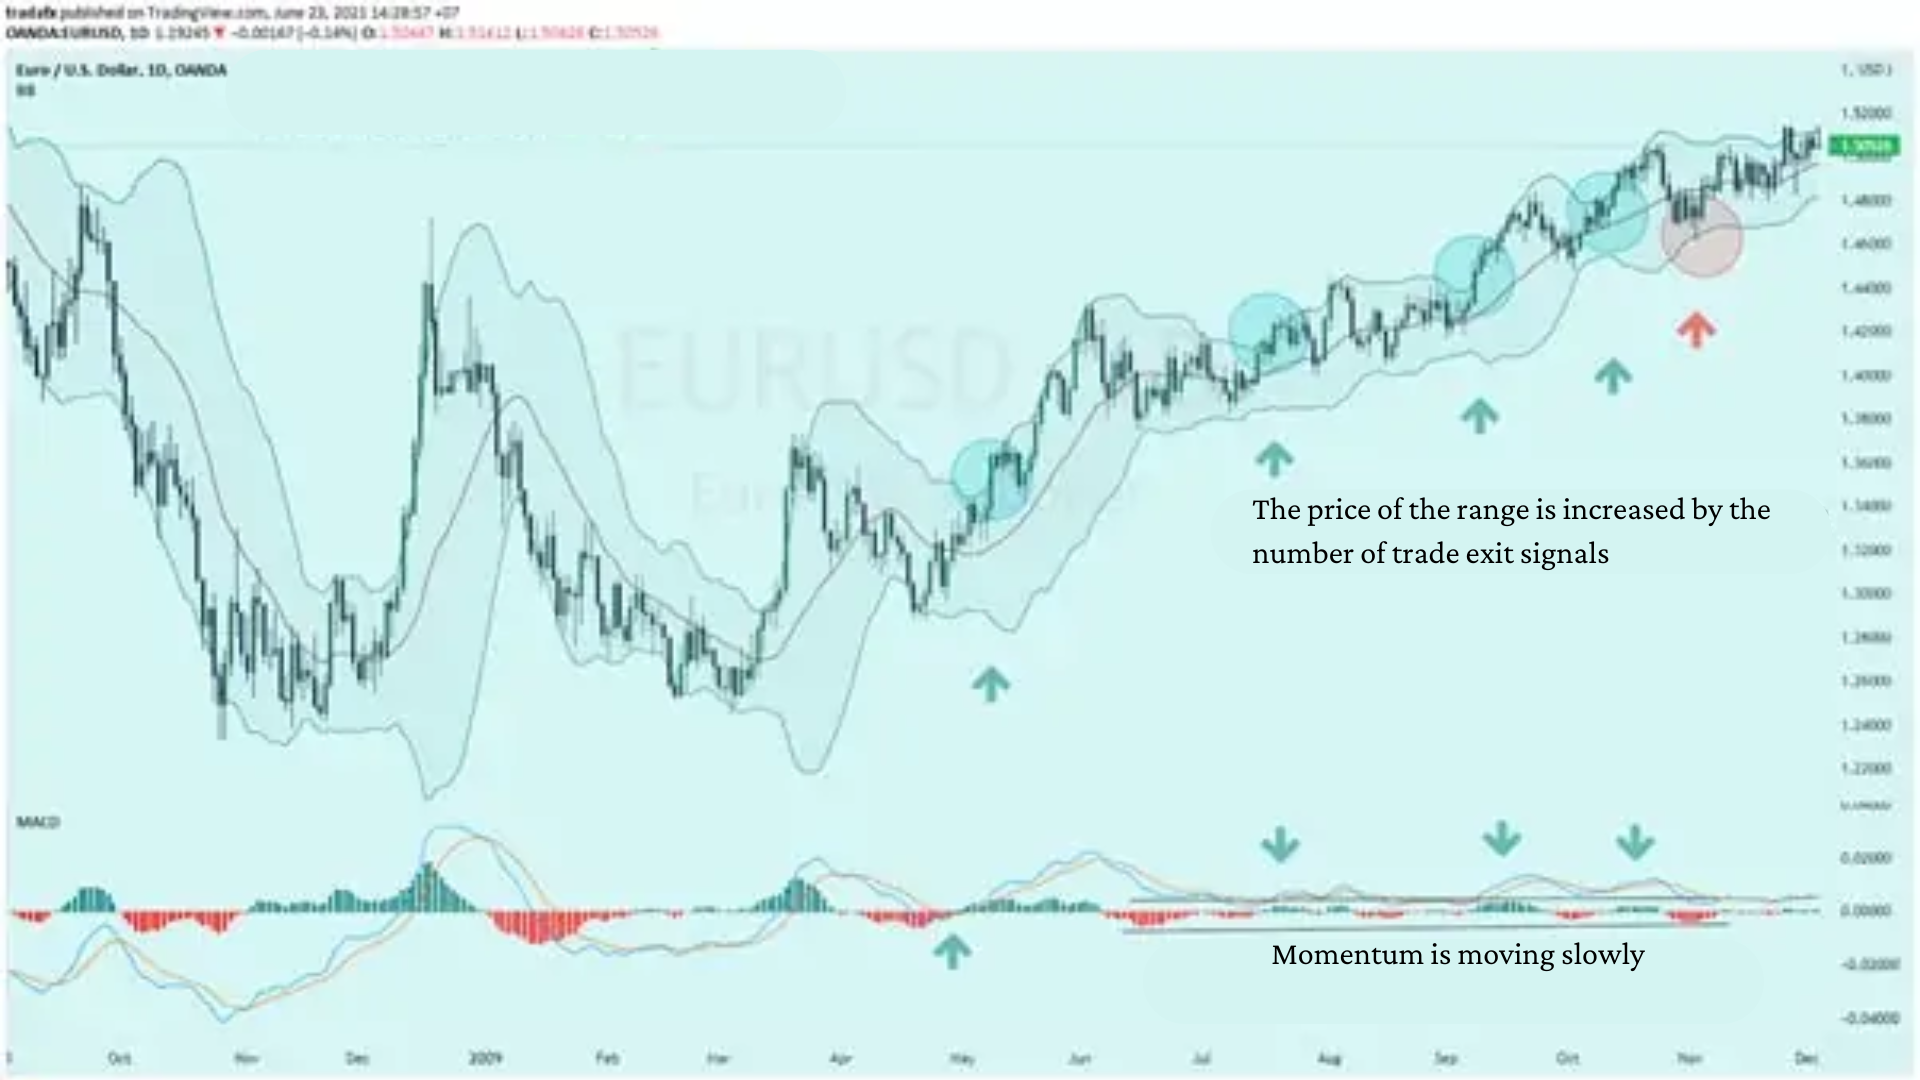
In the EUR/USD chart below, the trend-following strategy is illustrated. The MACD indicator confirms an uptrend: the MACD line is above the signal line, and both are above the zero line. This indicates that traders should only focus on looking for buy signals.
Example Strategy:
- Trend Identification: The MACD line above the signal line indicates the trend is upward.
- Entry Point: A pullback to the MA20 or a bounce off the lower Bollinger Band (in an uptrend) can provide an entry signal.
- Confirmation: The MACD confirms the continuation of the uptrend.
- Stop-Loss Placement: The lower Bollinger Band (or the most recent low) can serve as a stop-loss.
- Take-Profit Level: Use the previous resistance level for potential take-profit points, keeping a good risk-to-reward ratio.
By combining Bollinger Bands and MACD, traders can identify the strength of a trend and make more informed decisions, whether entering during pullbacks or following a breakout.
3. Trading Strategy – Advantages and Disadvantages of Using Bollinger Bands and MACD Together
Advantages:
- Versatility: Both Bollinger Bands and MACD can be applied to any asset and on any time frame. This makes them highly adaptable across different trading strategies and markets.
- Clear Entry and Exit Points: Bollinger Bands offer clear levels for stop-loss placements, with the lower band serving as a stop-loss for buy trades and the upper band for sell trades. This makes managing risk easier.
- Trend and Volatility Analysis: By combining the two indicators, traders can quickly assess both the trend and market volatility. This gives a holistic view of the market, helping to make more informed trading decisions.
Disadvantages:
- Complexity for Beginners: The combination of Bollinger Bands and MACD is not ideal for novice traders. It requires a deeper understanding of both indicators and their interactions to be used effectively. Without this knowledge, traders might struggle to correctly interpret signals.
- Conflicting Signals: While Bollinger Bands are more effective in ranging markets, MACD is designed for trend-following. When these indicators are applied inappropriately (such as during a trend reversal or a choppy market), they may give misleading signals. For example, a breakout using Bollinger Bands may occur while the MACD signals a slowdown in momentum, causing confusion for the trader.
Summary:
Trading Strategy with Bollinger Bands and MACD – The combination of Bollinger Bands and MACD provides a robust strategy for traders who are comfortable with these tools. It allows them to assess both trend strength and market volatility. However, due to its complexity, this strategy is best suited for experienced traders who are familiar with the nuances of both indicators. Beginners should approach this combination cautiously and consider practicing in demo accounts before applying it to live trading situations.
- t.me/finance_solutes
- Website: https://finance-solutes.com
- Hotline: +1 929 5636 439 ( Hotline )
- 26 Broadway, Suite 934, New York, 10004, US
