
 XM
XM Bybit
Bybit Binance
 Robinhood
 Webull
 IC Markets
 Pepperstone
 OKX
OKX Vantage
 VT Markets
 BingX
BingX Gate.io
 Kucoin
 MEXC
MEXC Exness
 Bitget
The Impact of CPI, PPI, ISM on Forex – One way to track market developments is by monitoring key economic indicators. In addition to reports on GDP and NFP, the CPI, PPI, and ISM data also have significant effects on the forex market. This article will discuss the concepts of these indices and how they impact forex trading.
1. CPI: Consumer Price Index
The Consumer Price Index (CPI) is a key indicator of price pressure in the economy and provides a measure of inflation. Forex traders closely monitor the CPI as it can lead to changes in central bank monetary policies, which in turn can strengthen or weaken a currency in comparison to its rivals in the market.
1.1. What is CPI?
CPI stands for Consumer Price Index, an important metric published periodically that indicates the current growth and inflation rates. By looking at the CPI, one can determine the price increase of goods and services in the economy, which also influences a country’s monetary policy.
CPI is calculated by taking a weighted average of the prices of goods and services over time. It includes items such as food and services like healthcare.
CPI is useful because it directly affects monetary policy and interest rates, as well as the strength of a currency.
1.2. CPI Release Dates
CPI is published monthly, although some countries, such as New Zealand and Australia, release it quarterly. Certain countries, like Germany, publish it annually as well. The U.S. Bureau of Labor Statistics has been releasing monthly CPI reports since 1913.
The table below shows the reporting agencies and publication frequency in some countries:
| Country | Reporting Agency | Frequency |
|---|---|---|
| Australia | Australian Bureau of Statistics | Quarterly |
| Canada | Statistics Canada | Monthly |
| China | National Bureau of Statistics of China | Monthly |
| Eurozone | European Central Bank | Bi-monthly |
| Germany | Federal Statistical Office of Germany | Monthly, Annually |
| Italy | Italian National Institute of Statistics | Monthly |
| India | Ministry of Statistics and Programme Implementation | Monthly |
| Japan | Statistics Japan | Monthly |
| UK | Monetary Policy Committee | Monthly |
| USA | U.S. Bureau of Labor Statistics | Monthly |
1.3. Why Forex Traders Should Track CPI Data
CPI is a strong inflation measurement tool. Therefore, it significantly influences central bank monetary policies. Understanding CPI is crucial for forex traders.
How does CPI affect the economy? Generally, higher inflation leads to higher interest rates. This is because policymakers aim to cool down the economy and reduce inflationary trends. As a result, the higher a country’s interest rates, the stronger its currency tends to be. Conversely, countries with lower interest rates usually see their currencies weaken.
The release and revision of CPI data can cause currency values to fluctuate. Forex traders can leverage this data for profit opportunities.
Additionally, CPI is considered a useful gauge for evaluating the effectiveness of government economic policies in relation to domestic economic conditions—something forex traders should consider when assessing currency volatility.
Combining CPI data with other indicators can give forex traders a clearer view of inflationary pressures.
1.4. Things to Keep in Mind When Trading with CPI Data
When using CPI data to make trading decisions, traders should consider market expectations for inflation and how currencies might react if these expectations are met or missed.
Similar to any major economic data, it can be beneficial not to take a position right before the release. Traders might consider waiting a few minutes after the data is released before looking for potential trade opportunities, as the bid-ask spread can widen significantly just before and after the report is published.
Below is a chart showing the U.S. monthly inflation rate. In the most recent month, expected inflation was set at 1.6% compared to last year’s data. A discrepancy between the published CPI and expectations can have a significant impact on the market.
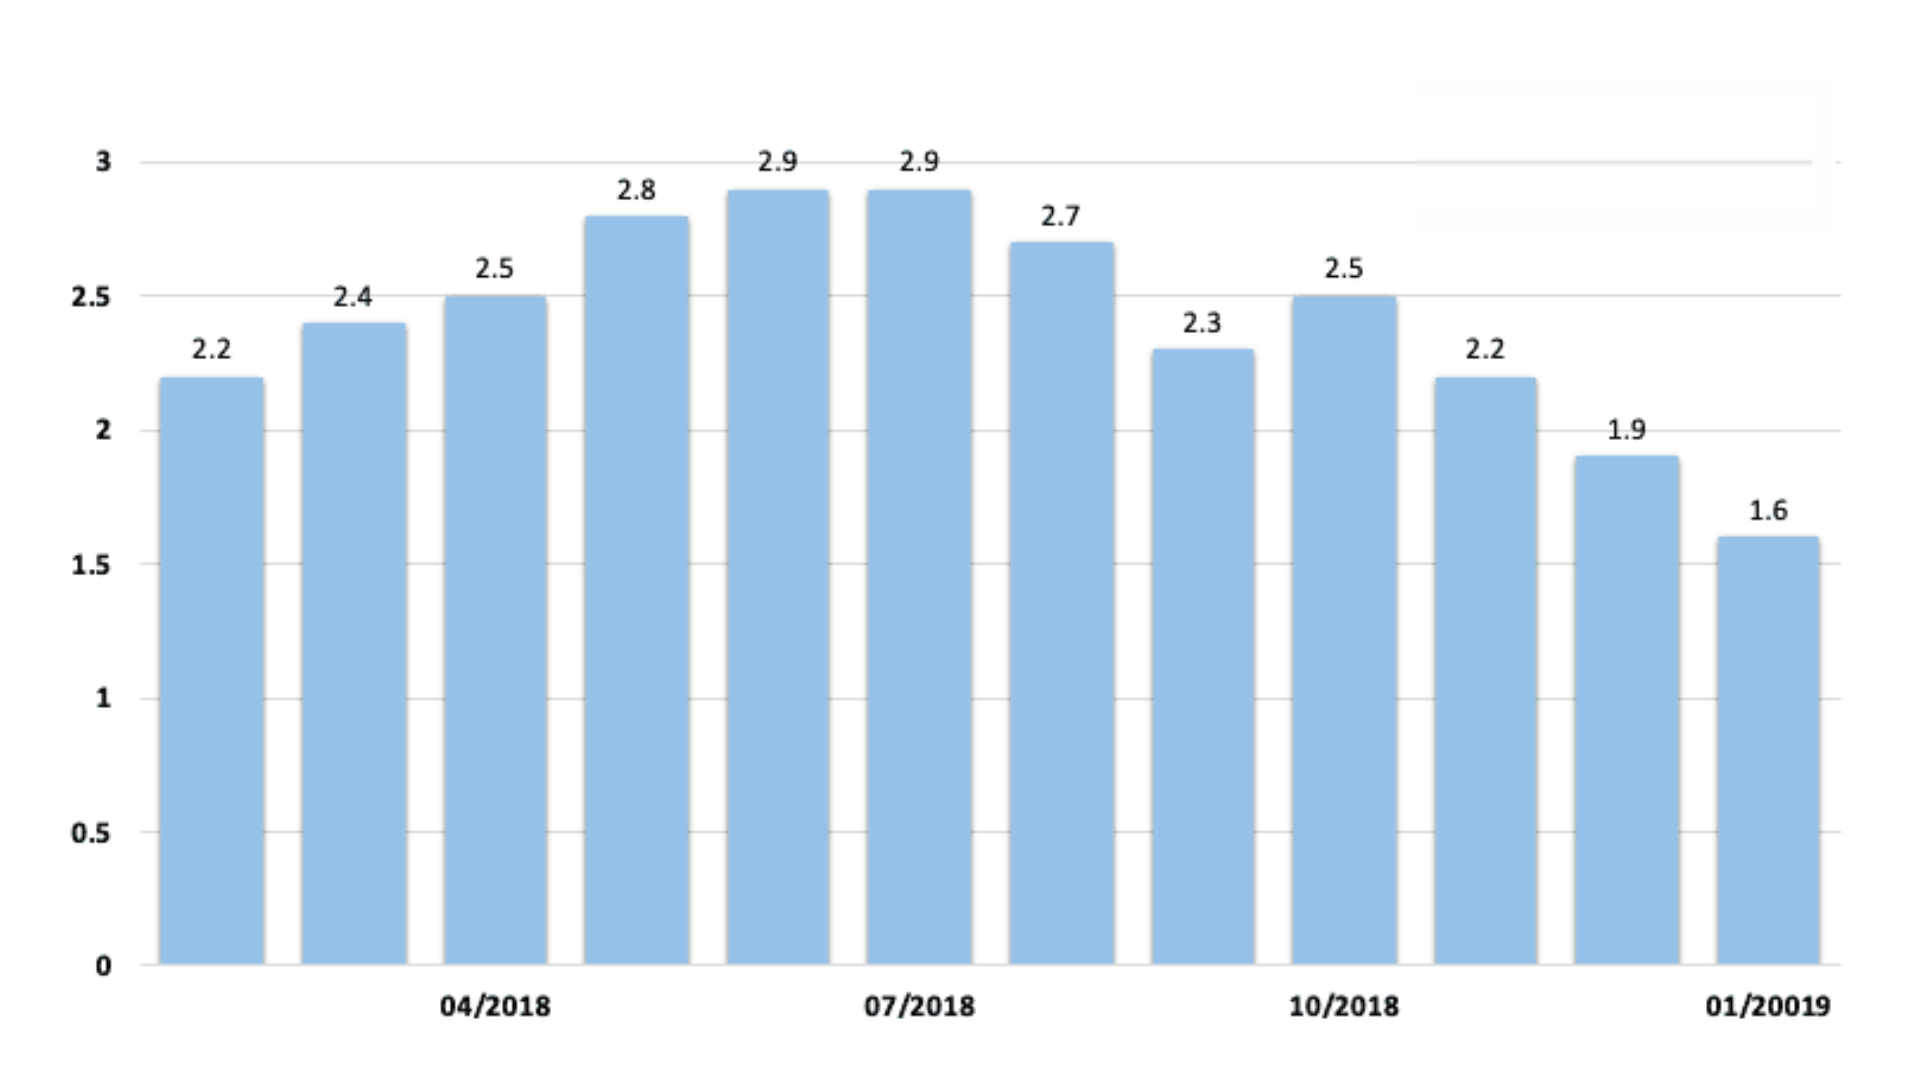
UK Inflation Chart for 2018/19. Source: TradingEconomics.com, U.S. Bureau of Labor Statistics.
Looking at the chart of the U.S. Dollar Index can help explain the impact of CPI. When the actual CPI data differs from expectations, it can cause the index to reach new highs or reverse from resistance levels.
Since the index is formed by currency pairs such as EUR/USD, USD/JPY, and GBP/USD, by tracking the U.S. Dollar Index, we can gain a full understanding of the results released.
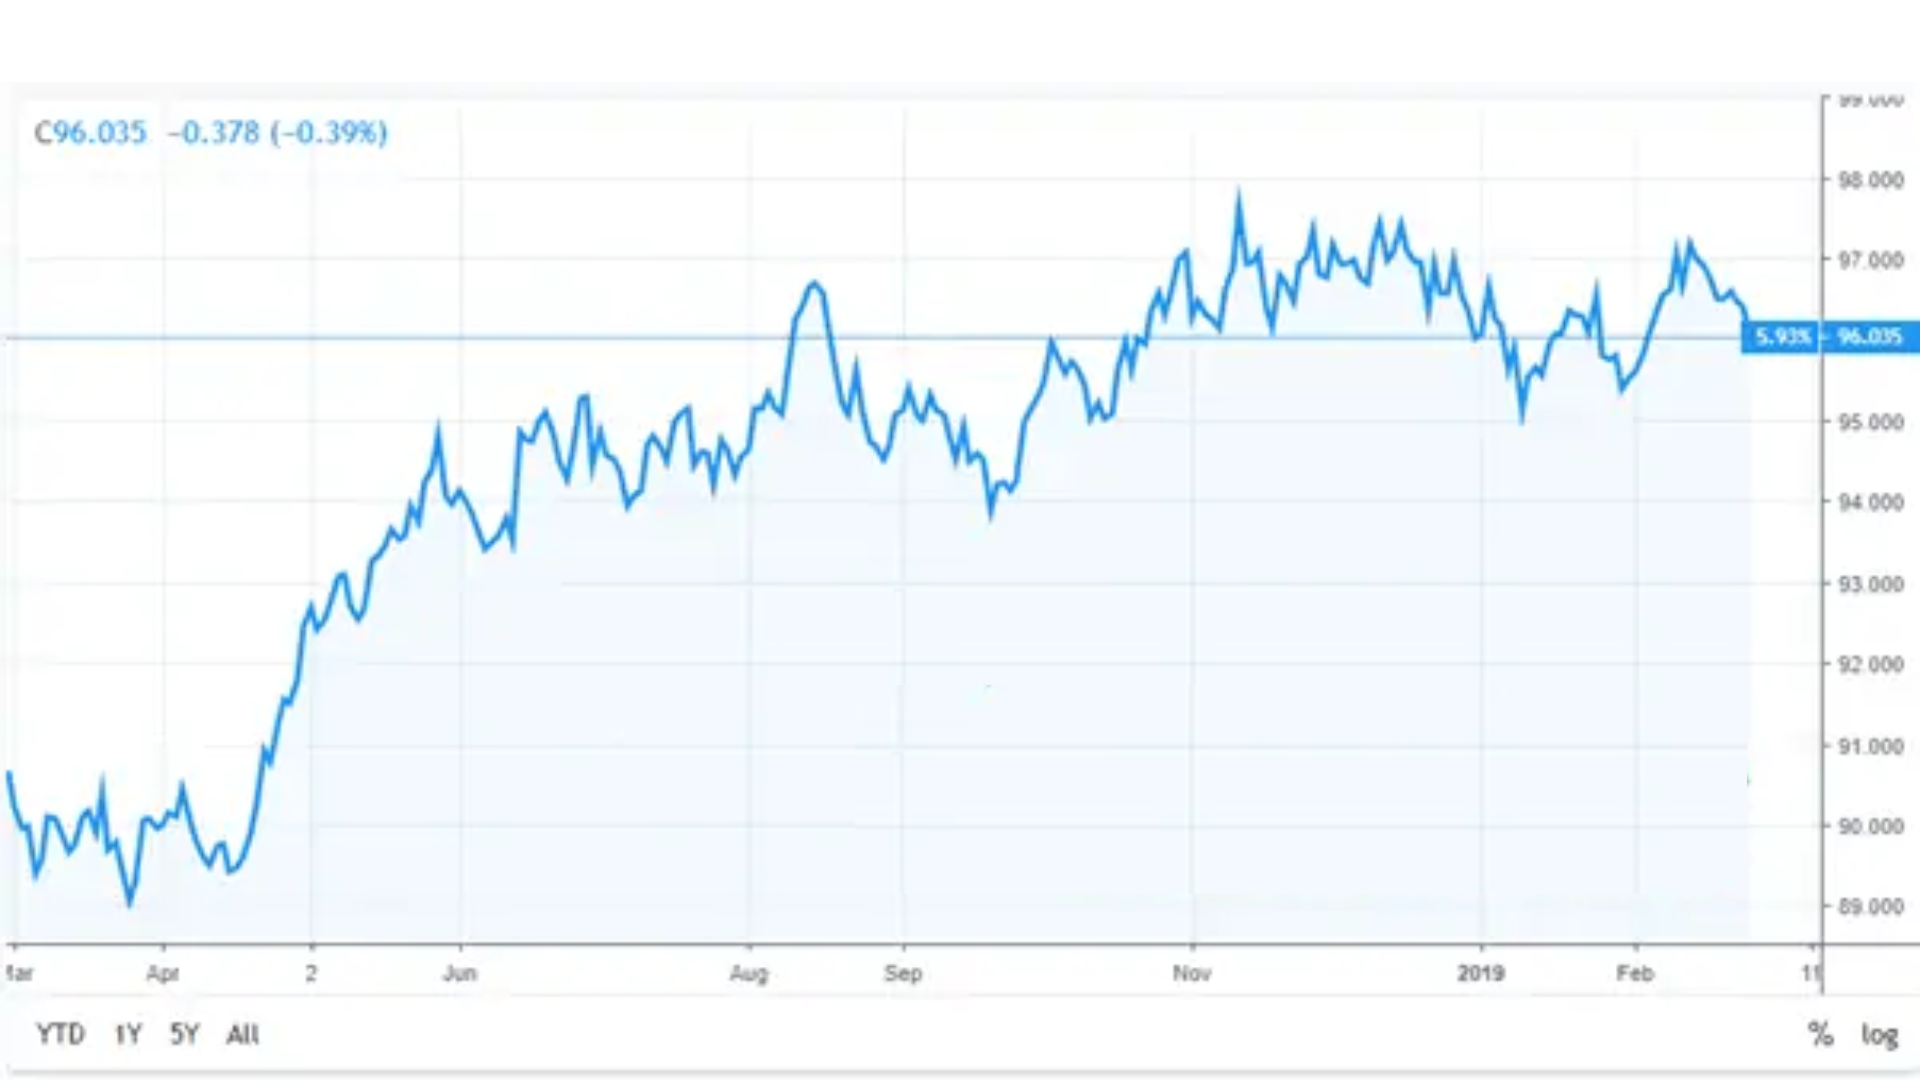
In the example above, when inflation increased in the first half of 2018, the U.S. Dollar Index also rose accordingly. However, as U.S. inflation gradually decreased in the following months and failed to reach the 2% target, the likelihood of a U.S. interest rate hike diminished. As a result, the U.S. dollar struggled and weakened against other currencies.
Not all economic news releases have the expected impact on prices.
After CPI data is released and analyzed, traders should consider whether the market price breaks through or rebounds from any key resistance levels. This will help traders understand the short-term strength of the move and/or the strength of support or resistance levels, aiding in more informed decision-making.
2. PPI: PRODUCER PRICE INDEX (PRODUCER PRICE INDEX)
PPI stands for Producer Price Index, and it measures changes in the prices of goods and services sold by producers. The PPI data represents the monthly changes in the average prices of a basket of goods purchased by manufacturers.
2.1. What is PPI, and how is it calculated?
2.1.1. What is PPI?
PPI (Producer Price Index) measures changes in the prices of finished goods and services offered by producers. It represents the average monthly price change of a basket of goods purchased by manufacturers.
2.1.2. How is PPI calculated?
PPI includes three production sectors: basic goods manufacturing, industrial production, and processing companies. It is published by the Bureau of Labor Statistics, and data is collected through a systematic sampling process from selected retailers via email surveys. All companies listed under the Unemployment Insurance System are included.
2.2. PPI and Inflation
An increase in PPI implies rising costs. Eventually, higher prices will be passed on to consumers. If this impact is significant enough, future CPI will increase, reflecting the overall price increase.

2.2.1. Inflation and Its Impact on the Economy
Price increases are often seen as a positive sign for the economy, but this is only true when the increases are controlled. When the demand for goods and services rises, businesses must invest more capital and hire additional labor to meet the higher demand. Problems arise when prices increase significantly, causing the purchasing power of a country’s currency to decrease. For example, $1 may not buy as much as it did a year ago.
In the 1950s, the price of gasoline was $0.27, while the rent was $42 per month. These figures are far from the current price levels and reflect how inflation erodes the value of a currency. In an effort to combat the erosion of purchasing power, central banks reduce inflation by increasing the standard interest rate.
2.2.2. How PPI Affects Currency
If PPI rises, it can lead to an increase in interest rates. When interest rates go up, saving money becomes more attractive because the rewards (interest) are higher than before. Spending money becomes more expensive due to the opportunity cost of losing out on interest when consumers choose to spend rather than save. Therefore, an increase in PPI may indirectly lead to higher interest rates, which strengthens the currency.
For example, in the case of the Euro, Forex traders know that higher interest rates lead to an increase in financial flows because foreign investors are attracted to buy Euros, which offer higher yields. This tends to drive the value of the Euro higher as demand for the currency increases.
One popular strategy that takes advantage of higher interest rates is the “Carry Trade” strategy. In this strategy, traders borrow a “funding currency” with a low interest rate to purchase a currency with a higher interest rate.
Money generates returns, and traders will seek to capitalize on this advantage.
2.3. How PPI Affects the U.S. Dollar
The Producer Price Index (PPI) tends to have a smaller initial impact on the U.S. dollar. This is because, in the real economy, there is a lag between when producers raise prices and when the result is higher inflation, which forces consumers to spend more.
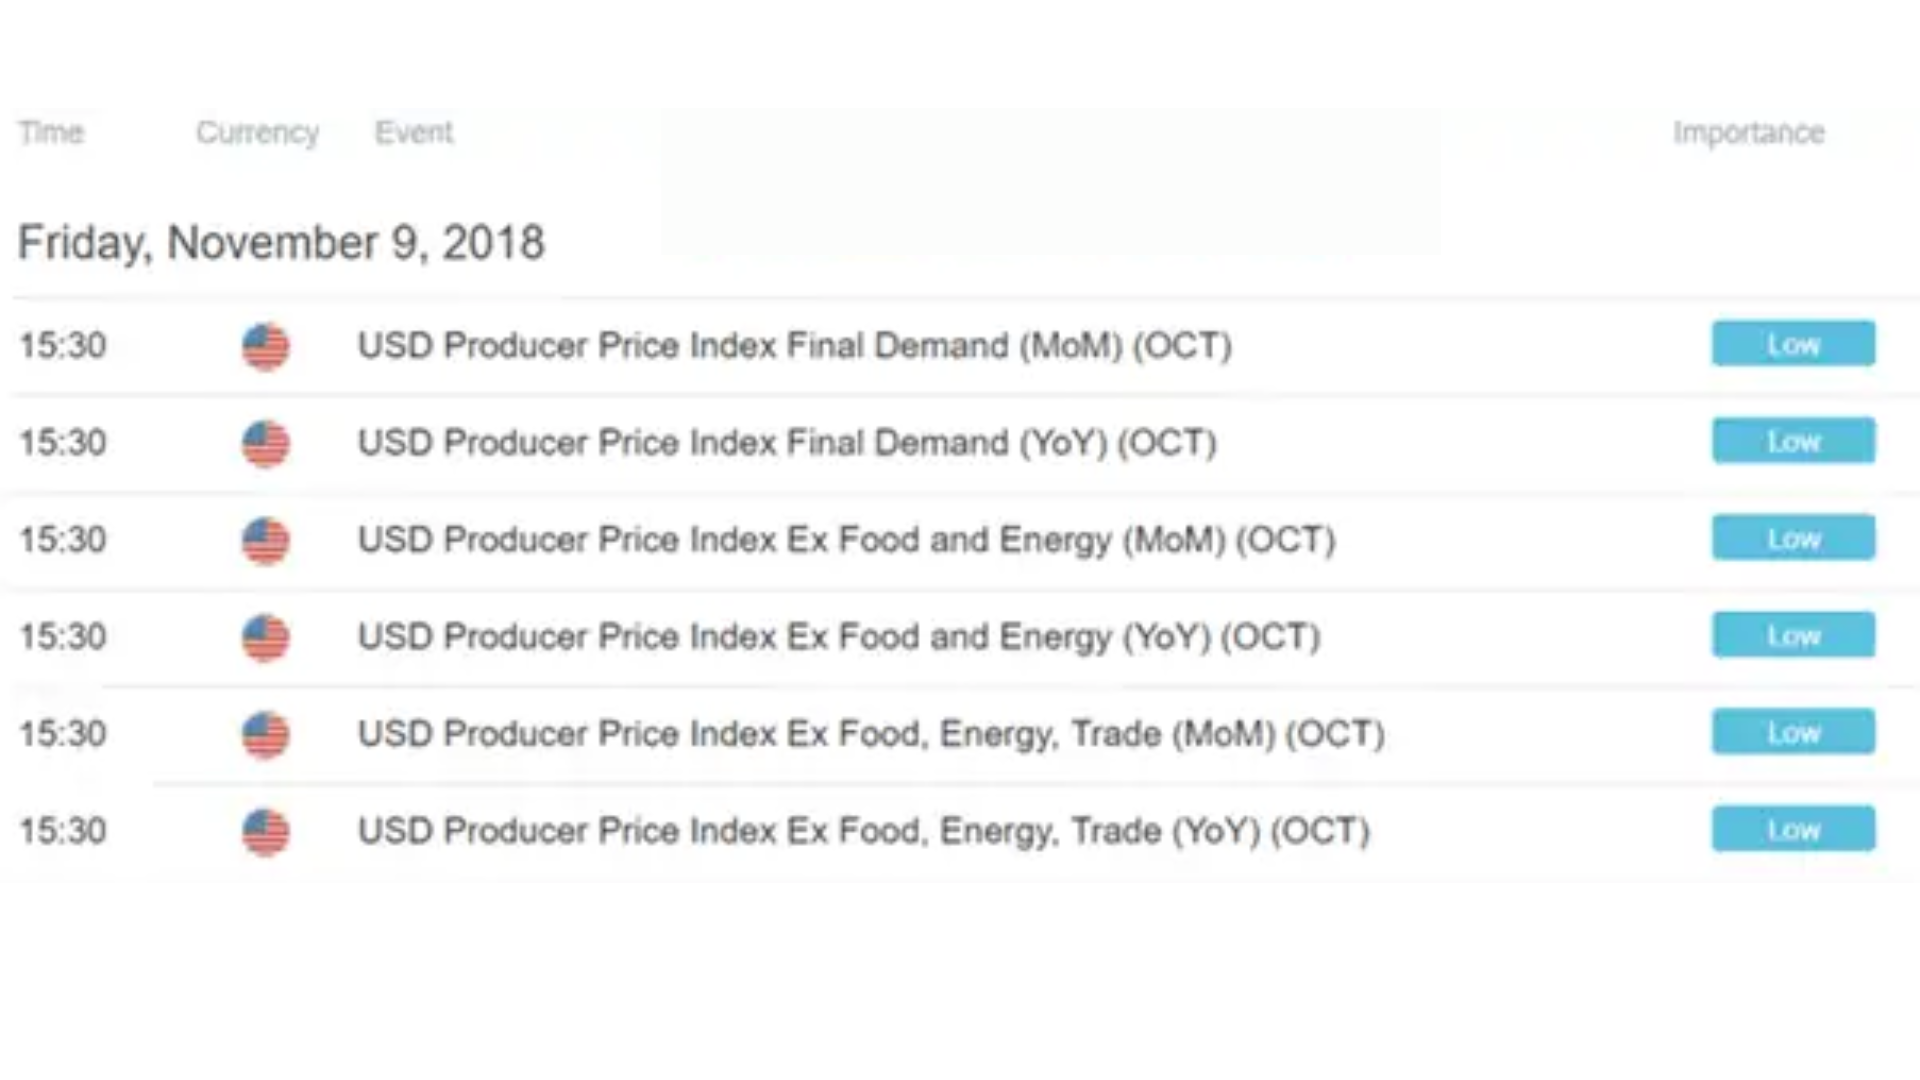
Sure! Here’s the translation:
However, do not be deceived by the “low priority” of the impact of this data. Savvy traders can anticipate the cascading effects that PPI can have on CPI and interest rates and trade accordingly. Therefore, the most important value of PPI data is the forecasting power it provides to the market.
3. ISM: Institute for Supply Management
The Institute for Supply Management (ISM) is the oldest and largest supply management organization in the world. Founded in 1915, it is a non-profit educational association based in the United States that serves professionals and organizations interested in supply management, providing them with education, training, certifications, publications, information, and research.
3.1. What is ISM?
ISM (Institute for Supply Management) measures economic activity from both the manufacturing and services sectors. ISM data is released monthly and includes key information such as changes in production levels.
ISM, founded in 1915, is the first supply management institute in the world with 300 member countries. ISM data is collected from purchasing managers in major countries, making it a reliable indicator for the global economy. The results from ISM can directly impact currency fluctuations, as the economy of a country is often defined by its supply chain. Therefore, PMI and ISM indices released monthly are crucial information that forex traders worldwide carefully analyze.
3.1.1. ISM Surveys
ISM releases three surveys on the first business day of each month. These three surveys are:
- Manufacturing
- Construction
- Services
The Purchasing Managers Index (PMI) is collected from a survey of 400 purchasing managers representing various sectors. These sectors include:
- Inventory
- Labor
- Supplier delivery speed
- Production levels
- New orders from customers
ISM releases the PMI Manufacturing index on the first business day of the month. Then, the PMI Construction index is released on the second business day, and the PMI Services index on the third business day. Forex traders will monitor these releases to assess risk levels.
3.2. How Does ISM Impact Currencies?
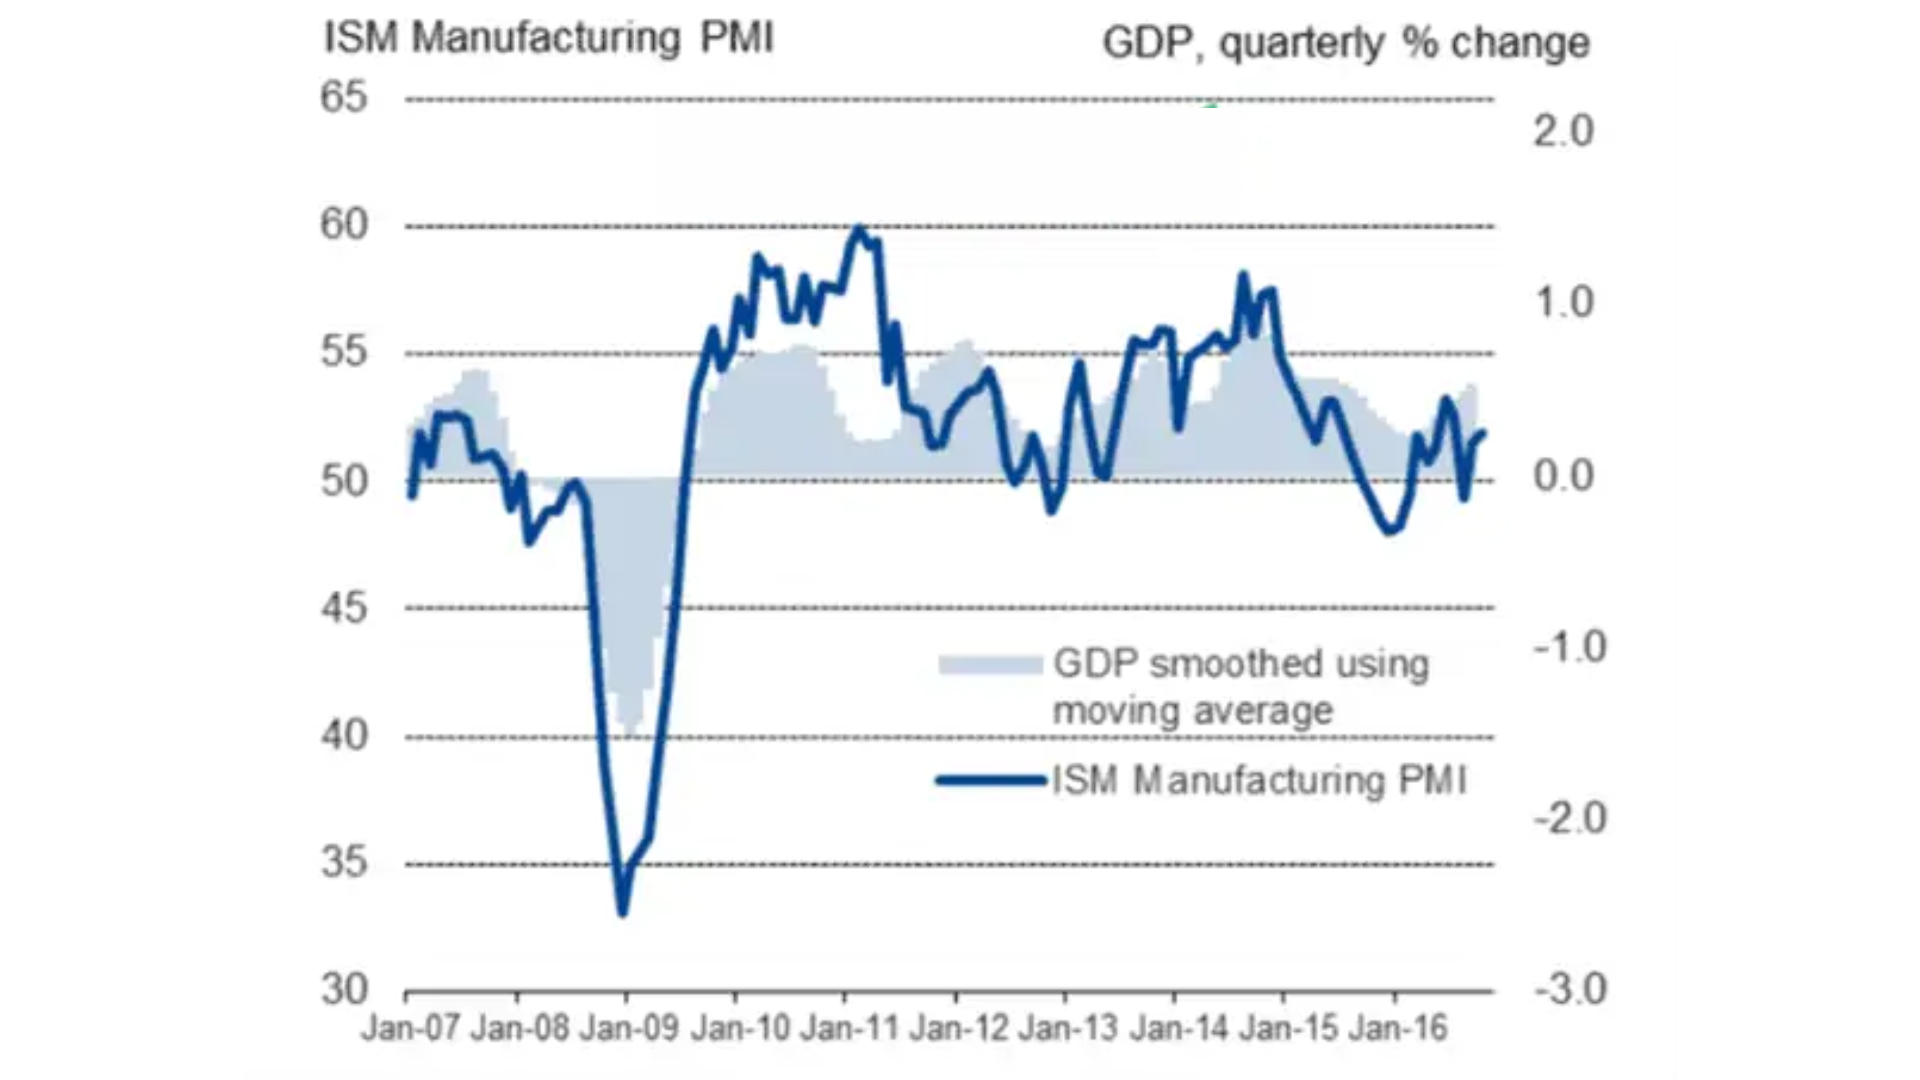
The Manufacturing PMI and Non-Manufacturing PMI are important indicators that can lead to significant market moves. This report is released at 10:30 AM (ET). At this time, currencies can experience strong fluctuations. This data is based on indicators collected from the previous month and industry experts, allowing traders to determine whether the economy is expanding or contracting, similar to Non-Farm Payroll (NFP) data.
Currencies react strongly to this information because it represents the overall health of the economy. When ISM reports growth or contraction in the manufacturing and services sectors, this information signals the strength or weakness of the economy, which directly affects the value of the country’s currency.
3.3. How Forex Traders Use ISM Data
Forex traders compare the current month’s ISM data with forecasts published by economists. If the ISM index is higher than the previous quarter and expectations, the US dollar tends to appreciate. This is how traders can leverage both technical analysis and fundamental analysis.
EUR/USD Weakens When PMI Data is Better Than Expected:
EUR/USD Daily Chart When PMI Data Was Released
The better-than-expected PMI data boosted the US dollar’s strength against the EUR. As seen in the chart, the PMI index was higher than the previous month, reaching 54.9.
When economic data exceeds expectations, sharp market moves can occur afterward. In this case, EUR/USD dropped by 150 pips within a few hours. Traders often choose the Euro as an “anti-dollar” currency to capitalize on capital flow shifts between the two largest economies.
A low US ISM Non-Manufacturing Index typically leads to selling pressure on the dollar, while the Euro appreciates. Another scenario is when the data is close to expectations, the US dollar may not react to the figures.
Overall, an ISM and PMI index above 50 indicates that the economy is expanding and performing well. However, when the number is below 50, it signals that the economy is weakening and contracting. If the PMI index is below 50 for two consecutive months, the economy is considered to be in a recession.
PMI is also collected for European countries by the Markit Group, while the US and regional PMI indices are handled by ISM.
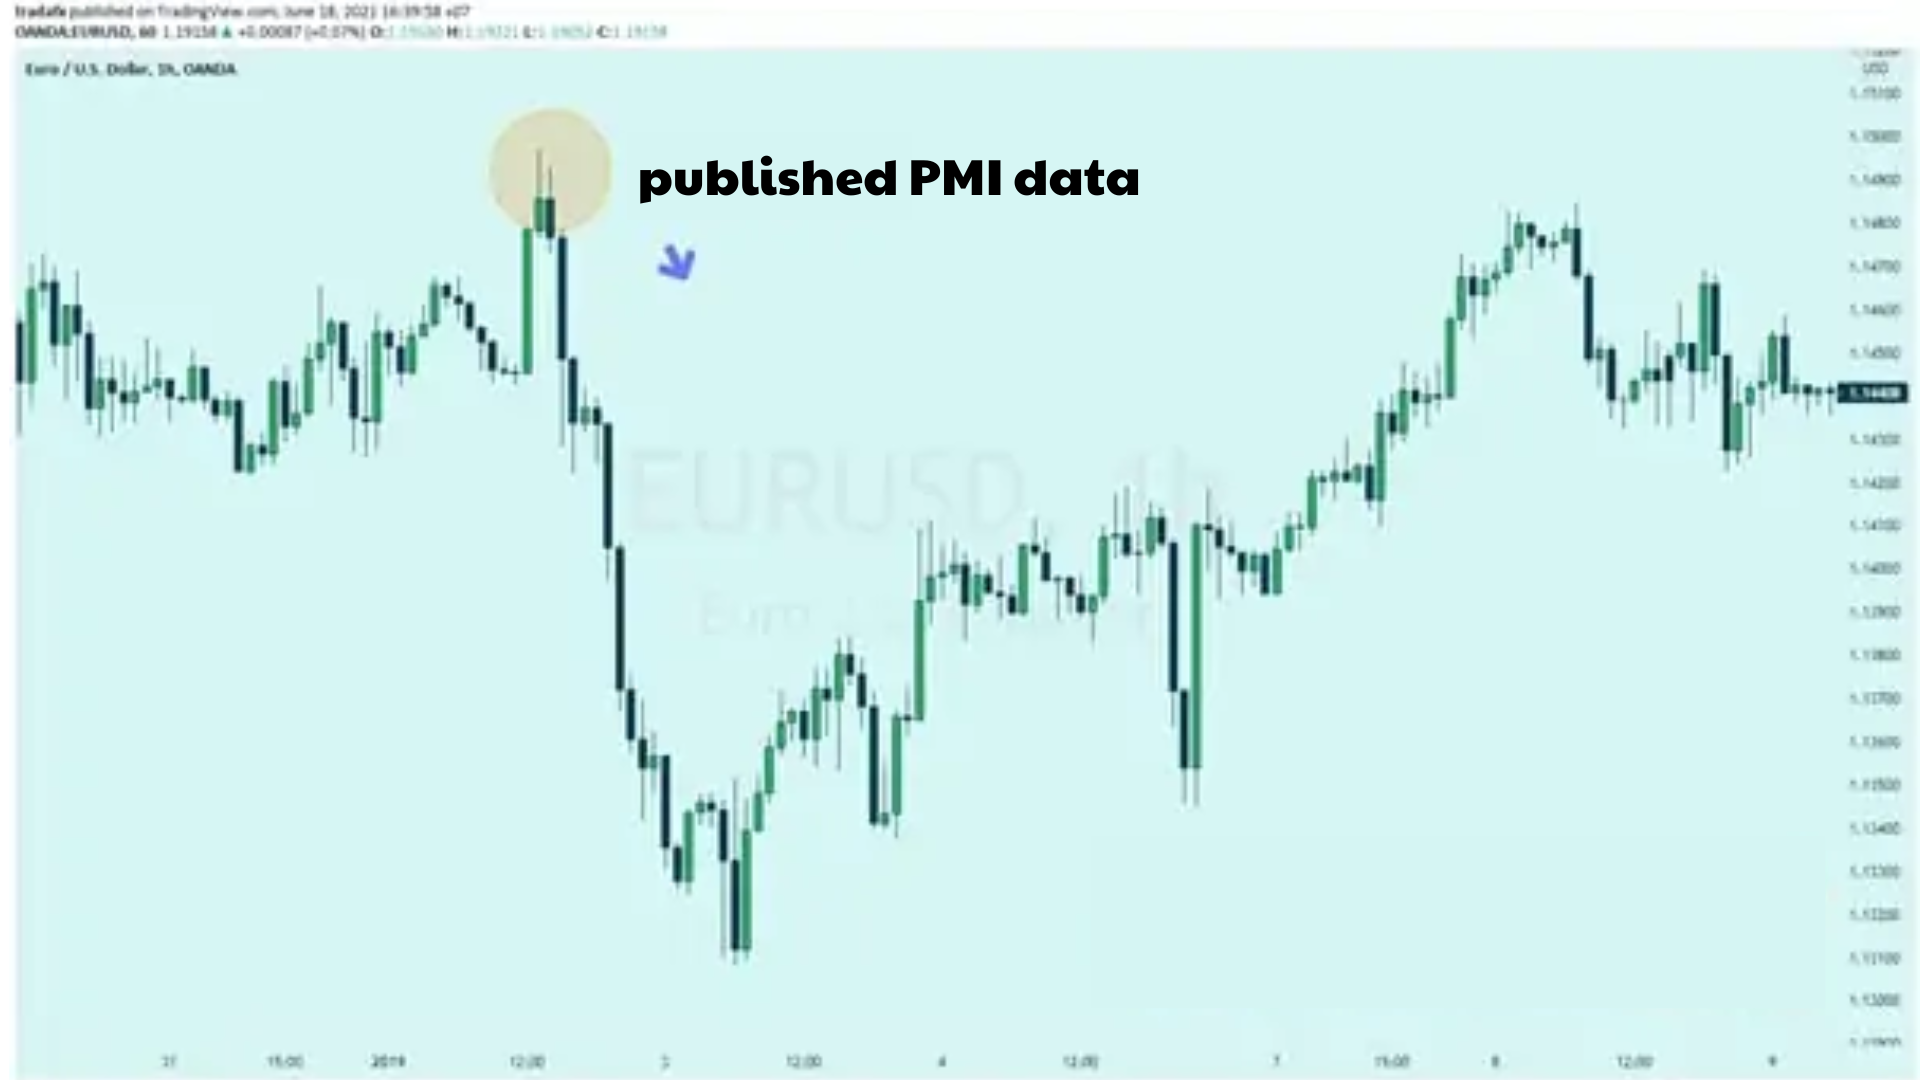
Better-than-expected PMI data helped boost the US dollar’s strength against the EUR. As seen in the chart, the PMI index was higher than the previous month, reaching 54.9.
When economic data exceeds expectations, sharp market moves can occur afterward. In this case, EUR/USD dropped by 150 pips within a few hours. Traders often choose the Euro as an “anti-dollar” currency to take advantage of capital flow shifts between the two largest economies.
A low US ISM Non-Manufacturing Index often leads to a sell-off of the US dollar, and the Euro appreciates. Another scenario is when the data is close to expectations; in such cases, the US dollar may not react to the figures.
In general, an ISM and PMI index above 50 indicates that the economy is expanding and performing well. However, when the number is below 50, it signals that the economy is weakening and contracting. If the PMI index is below 50 for two consecutive months, the economy is considered to be in recession.
PMI data is also collected for European countries by the Markit Group, while the US and regional PMI data are managed by ISM.
- t.me/finance_solutes
- Website: https://finance-solutes.com
- Hotline: +1 929 5636 439 ( Hotline )
- 26 Broadway, Suite 934, New York, 10004, US
