
 XM
XM Bybit
Bybit Binance
 Robinhood
 Webull
 IC Markets
 Pepperstone
 OKX
OKX Vantage
 VT Markets
 BingX
BingX Gate.io
 Kucoin
 MEXC
MEXC Exness
 Bitget
Volume Spread Analysis (VSA): A Signature Method in Forex VSA – Volume Spread Analysis is a trading method often regarded as exclusive to financial experts due to its complexity. Unlike the widely known fundamental or technical analysis, VSA adopts a completely different yet highly effective approach to identifying market trends.
Though not as mainstream, VSA is highly valued by those familiar with it, making it an underrated but powerful tool in trading.
So, what exactly is Volume Spread Analysis (VSA)? How does this method work in the Forex market? Let’s dive deeper into this intriguing topic with TradaFX in the following article!
1. What is the VSA Method?
Volume Spread Analysis (VSA) is a trading method focused on analyzing price fluctuations through the relationship between supply and demand in the market. This approach aims to predict future price trends by using only price charts and trading volume as its primary tools.
VSA is a market analysis technique that studies the activities of the most influential players in the market. It provides insights into why and when professional traders take positions.
The VSA theory posits that market price fluctuations are driven by imbalances between supply and demand. These imbalances stem from the actions of professional traders and large market participants. Such activities leave noticeable traces on the charts, and the VSA method interprets these to identify supply and demand dynamics using the relationship between three variables:
- Volume: The trading volume during a session.
- Spread: The price spread or range during a session.
- Close: The closing price of the session.
1.1. History of the VSA Method
The VSA method was developed by Tom Williams, a talented stock market investor. He also invented the renowned Wyckoff Volume Spread Analysis (Wyckoff VSA) computer trading program, which has greatly influenced the trading community.

Insights from Tom Williams
After attending the Wyckoff course in Park Ridge, Tom Williams gained a profound understanding of market movements. He realized that all the clues traders need lie within the charts—provided they know how to interpret them accurately.
Building upon Wyckoff’s principles, Williams emphasized the importance of price spread and its relationship with trading volume and the closing price. In 1993, he shared his insights with the public through the book Master the Markets and developed the Wyckoff VSA trading program, as it is known today.
In his research, Williams noted:
“Markets do not move randomly, as many traders believe. They fail to understand the market’s underlying dynamics and instead trade based on herd mentality.”
He added:
“If you understand the supply-demand relationship from the price charts, you’ll gain an edge over the uninformed crowd and can trade in harmony with smart money flows.”
1.2. VSA and VPA Methods in Forex
The VSA (Volume Spread Analysis) and VPA (Volume Price Analysis) methods focus on identifying smart money flows by combining price action with trading volume. These approaches are based on the theories and methodology of the renowned analyst, Wyckoff.
| VSA (Volume Spread Analysis) | VPA (Volume Price Analysis) |
|---|---|
| Seeks to determine the cause of price fluctuations. This cause is rooted in the imbalance between supply and demand in the market, created by professional traders’ activities. | An effective price action methodology that combines price charts, candlestick patterns, market cycles, and trading volume to identify the actions of smart money or institutional traders. This helps traders align their strategies with market trends. |
1.3. Components of the VSA Method
The VSA method revolves around three key components, which also serve as its main variables:
- Volume (Trading Volume):
- Many traders underestimate the importance of trading volume.
- While some indicators incorporate volume into price movements, these often have limitations.
- Spread (Price Spread):
- This is the price range within a trading session, calculated as the difference between the opening and closing prices (the length of the candlestick body).
- Note: In VSA, “spread” refers to this price movement range, not the bid-ask spread that many are accustomed to.
- Close (Closing Price):
- The closing price is considered the most critical information in VSA analysis.
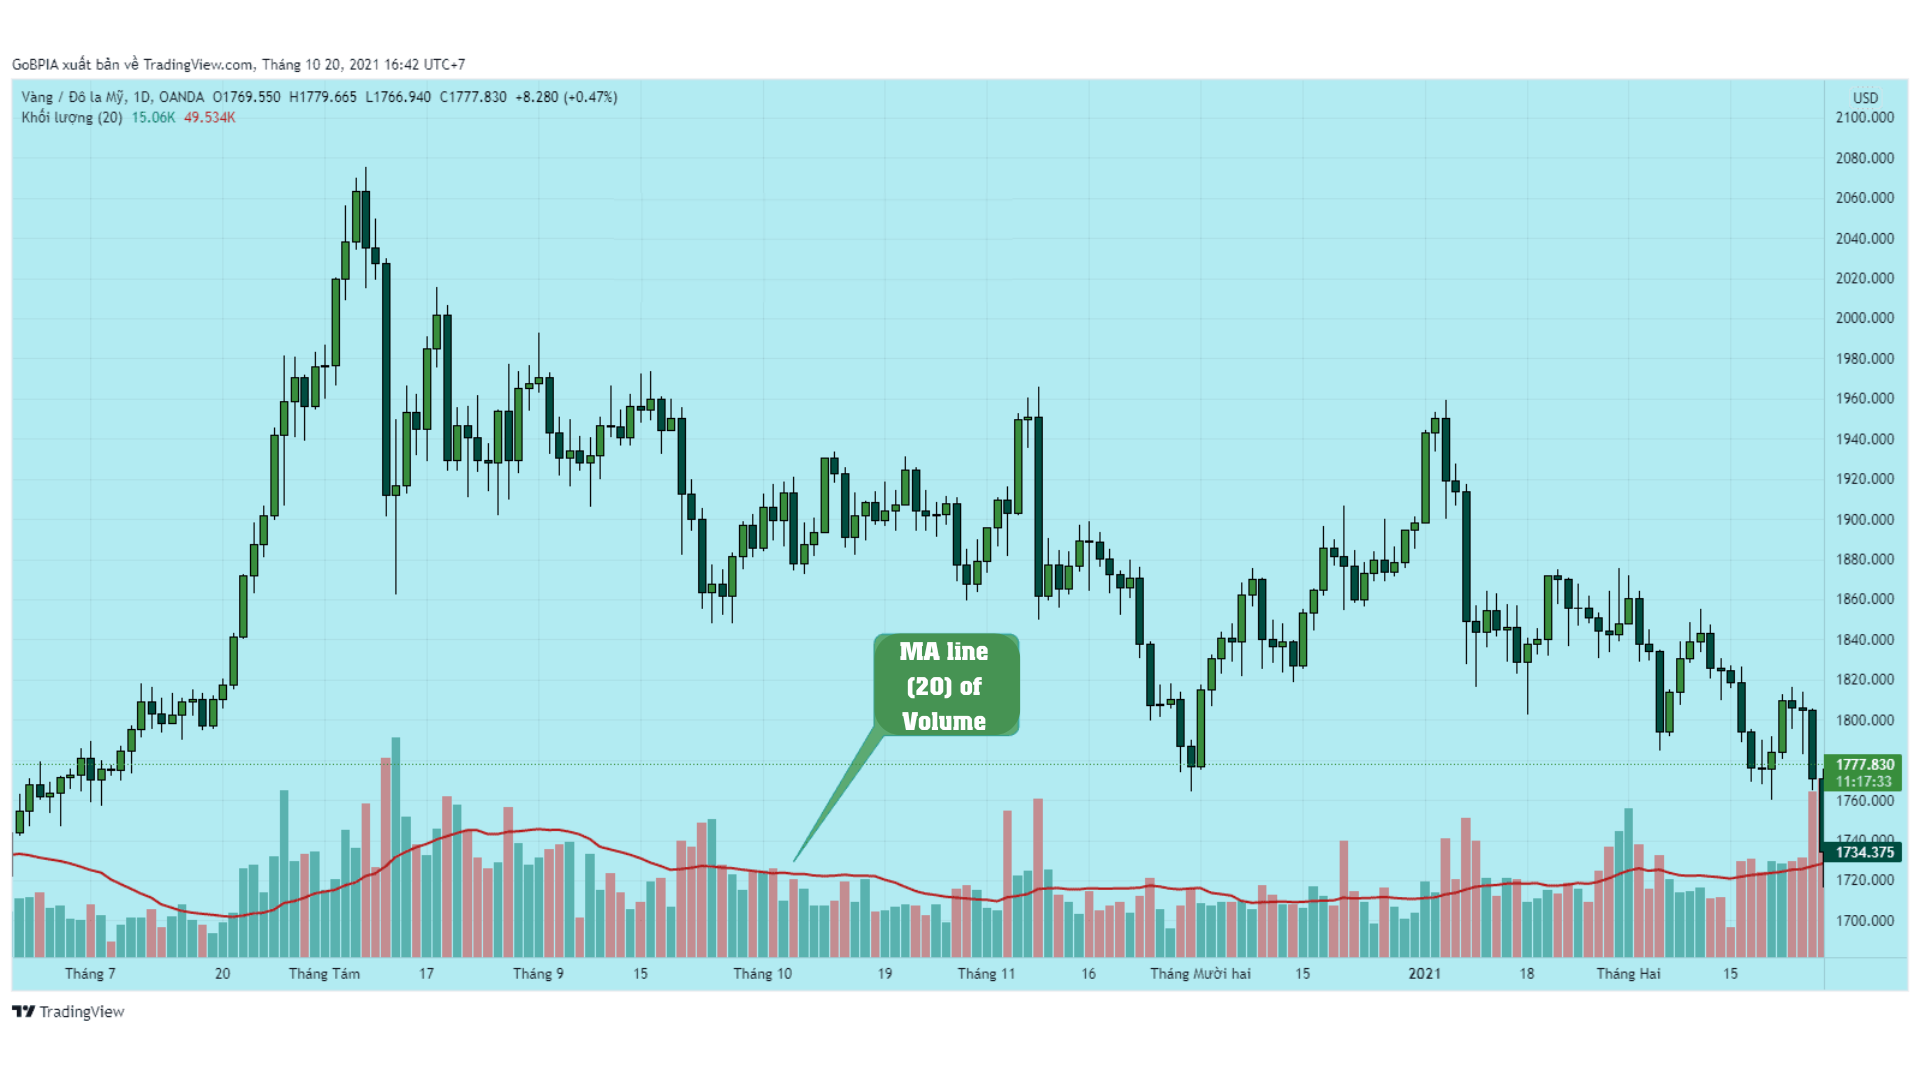
By analyzing these components, traders can identify the market’s supply-demand dynamics and align their strategies with smart money flows.
2. VSA Method in the Stock Market
In the stock market, the VSA (Volume Spread Analysis) method is based on the assumption that stock prices move due to the actions of the “big players”, who control the supply and demand of stocks or even the market itself. These “big players” can be referred to by various names such as market makers, big boys, market operators, or whales. These entities have vast financial resources and expertise, making them the market’s dominant forces. Retail traders can only profit in the market by following them and riding the big waves they create.
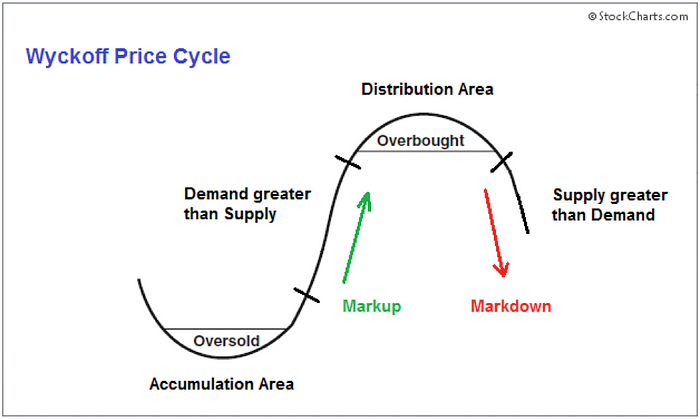
Here’s how the process typically works, according to the VSA method:
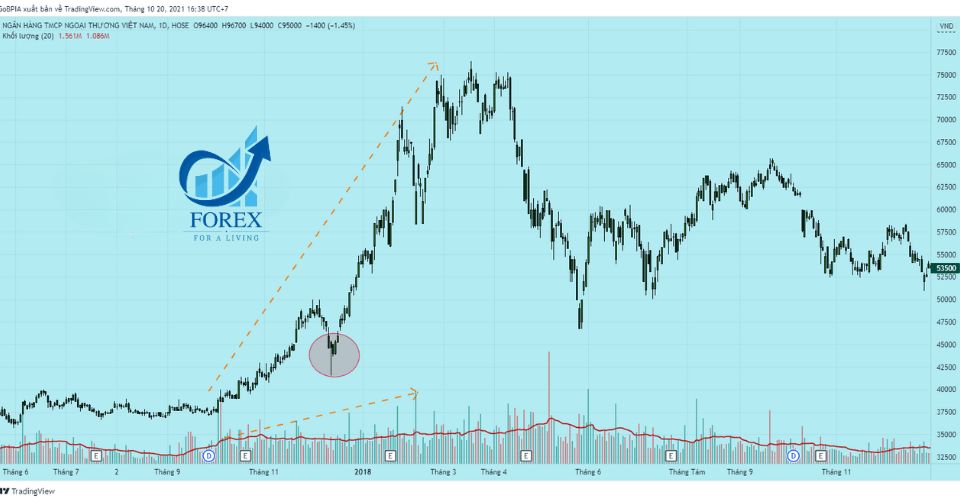
The practical example on the VCB price chart in the Daily timeframe:
1. Accumulation Phase
- Objective: Accumulate shares at low prices.
- Action:
- The big players quietly begin buying up stocks at favorable prices without drawing attention.
- This process is known as accumulation, where the price may not move much, but the volume increases slightly as the “big players” collect shares.
- Chart Behavior: Small candlesticks with moderate volume indicate the quiet accumulation phase.
2. Markup Phase
- Objective: Drive the price up and attract retail investors.
- Action:
- Once the big players have accumulated enough shares, they start pushing prices higher, creating an upward trend.
- As prices rise, retail investors begin noticing and start buying in.
- Chart Behavior: Price moves sharply upward with increasing volume, reflecting growing retail participation.
3. Distribution Phase
- Objective: Sell the accumulated shares at high prices.
- Action:
- At the peak, when retail investors are excited about the price increase, the big players begin selling their shares.
- This selling is done gradually, so as not to cause a sudden price drop.
- Chart Behavior: Price fluctuates with large candlesticks and high volume, reflecting increased selling pressure from the big players.
4. Markdown Phase
- Objective: Complete the cycle by buying back shares at lower prices.
- Action:
- As the big players sell off their shares, prices start to fall, and demand from retail investors dries up.
- At this point, the price drops sharply, and sometimes the big players will force prices even lower to induce panic selling from retail traders.
- Chart Behavior: Long red candlesticks with high volume, indicating widespread panic selling.
Conclusion
This cycle repeats itself as the big players accumulate shares at lower prices and then distribute them at higher prices, making profits in the process. Retail traders, who don’t fully understand this cycle, may end up holding on to losing positions. By recognizing these phases and patterns using the VSA method, retail traders can align themselves with the movements of the big players, improving their chances of success in the market.
- VSA METHOD BOOKS PDF IN FOREX
In this section, TradaFX will introduce to you two basic VSA method PDF books that are considered the foundation of VSA analysis:

3.1. The Modern Wyckoff Method VSA Book
The book The Modern Wyckoff Method will provide you with a classic Price Action method, originally used by a successful trader, Richard Wyckoff, and further upgraded by a trader with over 40 years of experience, David Weis.
In this book, readers will learn about the most fundamental yet consistently effective elements, including the relationship between Price Action and Volume, market cycles, trendlines, spikes/bounces to eliminate small traders, and signals from smart money to reverse or push the market trend.
Wyckoff’s VSA book is considered part of the classic Price Action school and is a must-know when studying technical analysis and trading in financial markets. The father of this method, Richard Wyckoff, was an extremely successful stock trader who utilized technical analysis through reading charts and price bands to understand market behavior. His success and wealth are widely recognized. He is ranked among legendary traders like Jesse Livermore and W.D. Gann.
3.2. The VSA Method in Forex by Muhammad Uneeb VSA Method in Forex is an eBook translated from the original book The Wyckoff’s VSA Methodology by Muhammad Uneeb. After reading this book, you will be able to understand and apply the VSA analysis method in forex trading.

As mentioned earlier, VSA is an improvement based on the original theory of Richard Wyckoff (author of the famous Wyckoff Method in stock trading).
This book focuses on VSA analysis (price spread and volume analysis) using candlestick charts, so it will help you become more confident when analyzing charts. In fact, no matter which technical analysis method you use, such as Price Action, classic chart patterns, Harmonic patterns, or Elliott Waves, VSA will always be a great addition that acts as a “confirmation” of your trading probabilities and expectations.
- SUMMARY
In this article, TradaFX has introduced you to the VSA method, its history, and how to trade using VSA in the financial markets. We hope the information provided will be helpful in your forex trading and investment journey.
Wishing you success in your trading career!
- t.me/finance_solutes
- Website: https://finance-solutes.com
- Hotline: +1 929 5636 439 ( Hotline )
- 26 Broadway, Suite 934, New York, 10004, US
