
 XM
XM Bybit
Bybit Binance
 Robinhood
 Webull
 IC Markets
 Pepperstone
 OKX
OKX Vantage
 VT Markets
 BingX
BingX Gate.io
 Kucoin
 MEXC
MEXC Exness
 Bitget
Combining Doji candlestick and RSI is a simple yet highly effective trading strategy. However, to succeed with this method, traders need to be sharp enough to confirm the signals for each pattern type. Let’s dive into this topic with TradaFX today and explore how to effectively use these tools in your Forex trading strategy.
Let’s get started!!!
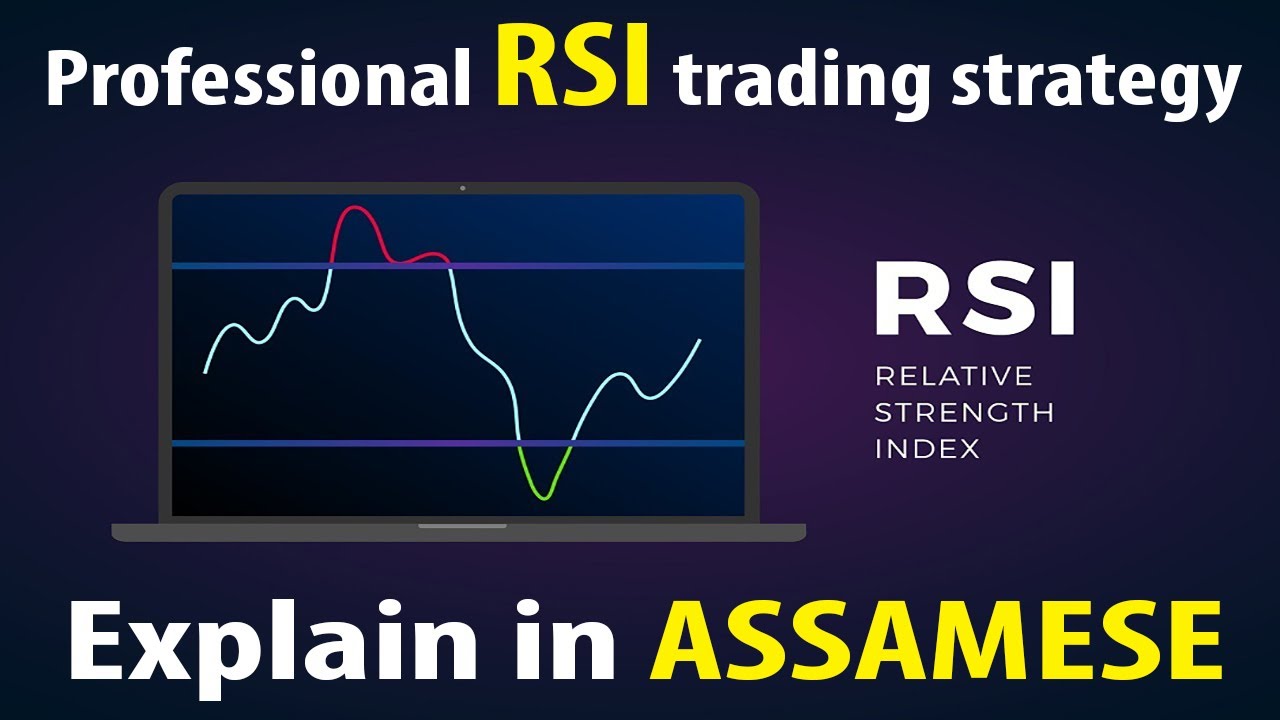
1. Combining Doji – RSI Indicator
1.1. Reminder of the RSI Indicator Concept
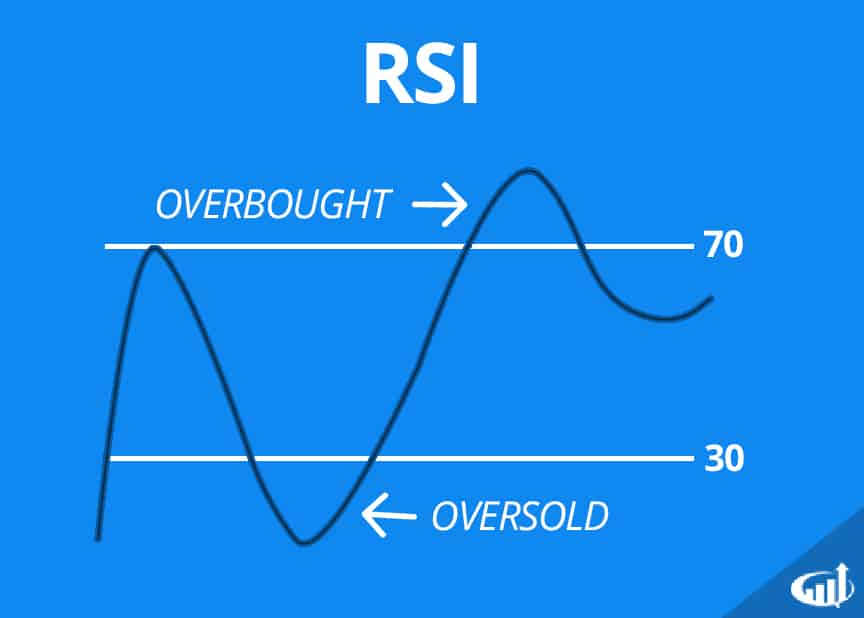
RSI (Relative Strength Index) is a momentum indicator that measures the rate of price changes to assess whether the market is in an OVERBOUGHT or OVERSOLD condition.
The RSI is presented as an oscillator, which is a line chart moving between two limit levels, measured on a scale from 0 to 100.
1.2. Combining Doji – The Significance of the RSI Indicator
For traders, RSI is an important indicator. It helps them know when to enter or exit trades. Here’s what the RSI line represents when trading Forex:
- RSI Overbought Area: When the RSI crosses above the 70 mark, it indicates an overbought condition. At this point, the price has reached a peak and is likely to experience a downward correction.
- RSI Oversold Area: When the RSI drops below the 30 mark, it indicates an oversold condition. The price is likely nearing its bottom, and a correction to the upside is expected.
Thus, by identifying overbought and oversold levels, traders can determine the optimal times to place buy or sell orders, increasing their potential profits.
2. Combining Doji Candlestick and RSI in Forex
The method of combining Doji candlesticks with RSI is popular among traders due to its simplicity and high accuracy.
The Doji candlestick pattern is highly significant for both novice and professional traders as it reflects the indecision between the buyers and sellers.
Candlestick patterns are among the most effective ways to forecast price movement. Japanese candlesticks help traders find better entry points, maximize profits, and minimize risks. However, relying solely on candlestick patterns is not enough. They should be combined with other signal indicators to develop more effective trading strategies.
There are many ways to combine tools with candlestick patterns. Specifically, when using the RSI to identify potential trend reversals, you may recognize a reversal is coming, but not know exactly when or where it will happen. That’s where the Doji candlestick pattern comes in—it helps pinpoint the exact reversal point for entering a trade.
Thus, by combining these two tools, market noise is minimized, and the effectiveness of trade setups increases. The RSI indicator helps detect potential reversal signals, while the candlestick pattern determines the exact timing and entry point for trades.
2.1. Trading Rules for Doji Candlestick and RSI
- Identify a Doji candlestick (where the opening price is equal to or very close to the closing price) under overbought (RSI above 70) or oversold (RSI below 30) conditions.
- After identifying the Doji candlestick, set pending orders.
- Buy at the high of the Doji candlestick.
- Sell at the low of the Doji candlestick.
- Set profit targets and stop losses based on the price range of the Doji candlestick for both pending orders.
- Once one of the positions is triggered, double the size of the pending order that hasn’t been activated yet.
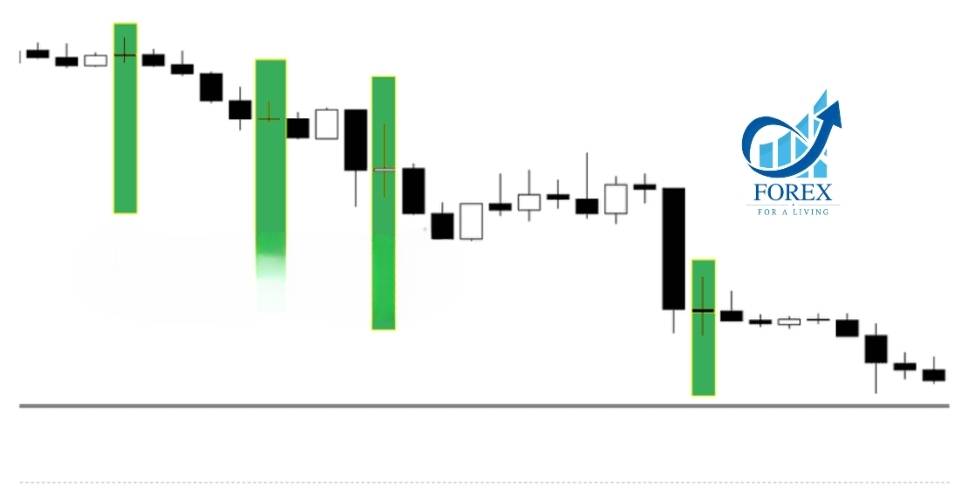
Price rarely stays within the narrow range formed by a Doji candlestick. Entering the second trade yields profit from a false breakout, but sometimes even the second position can turn out to be a false breakout. In such cases, we enter the trade on the third attempt.
2.2. Combining Doji – Entry Strategy
- Place the entry at the price level of the first failed entry, with the same take profit (TP) and stop loss (SL).
- This time, trade with double the size of the second position.
- There are three opportunities to turn the entry into profit.
As you might guess, winning trades occur much more frequently than losing trades.
3. Combining Doji Candlestick with Strong Support and Resistance Levels
We can also trade the Doji candlestick pattern in conjunction with strong support and resistance levels because the likelihood of a trend reversal at these price zones is higher. Furthermore, in forex and investing, there is a simple principle: everything has its probability. However, when we combine multiple reversal signals at once, the chances of success are significantly higher. Additionally, by applying tight risk management, avoiding over-leveraging, and not overloading trades that can quickly deplete the account, the risk of account depletion (or “blowout”) can be greatly minimized. As long as we remain in the market, we still have the opportunity to earn profits.
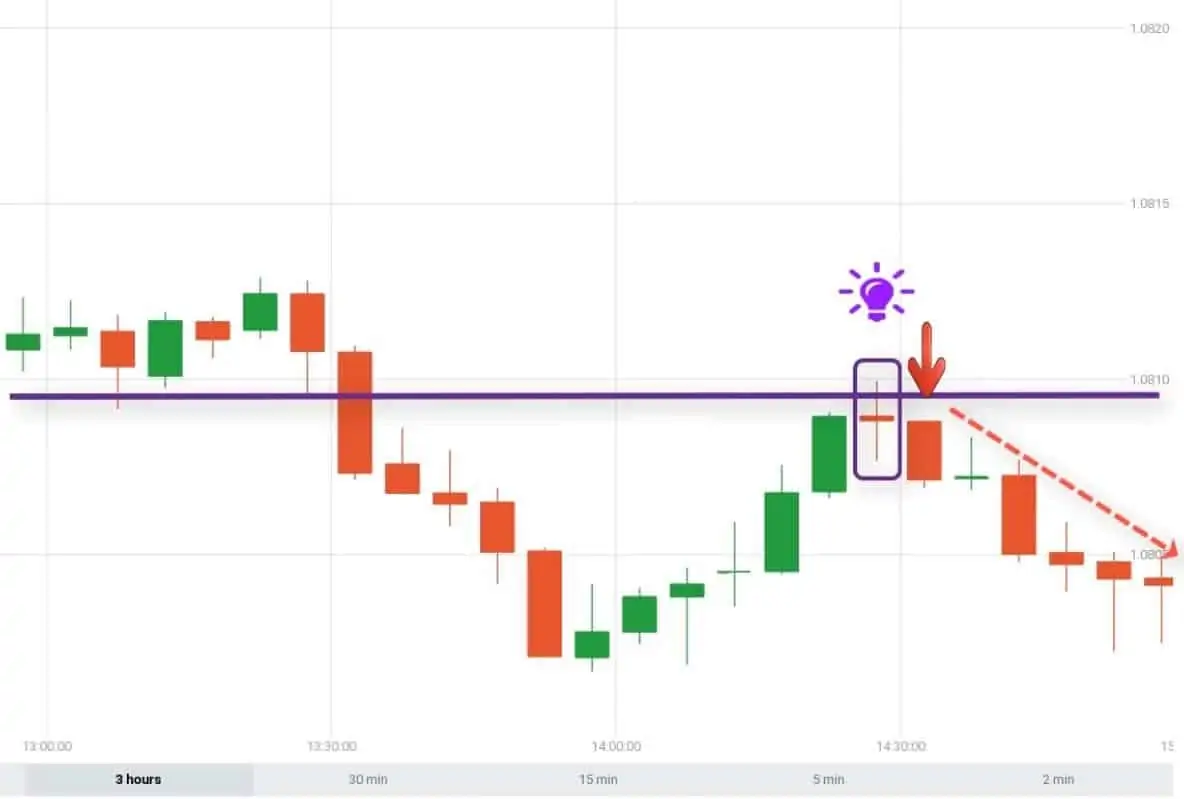
Finally, keep an eye on economic events. Be aware of the events on the economic calendar, as even the most beautiful candlestick patterns can become useless or lead to incorrect analysis if they occur too close to the release of important news.
4. Conclusion
In today’s article, TradaFX has shared with you how to combine the Doji candlestick and RSI in forex trading. We hope you will successfully apply these insights into your trading strategies moving forward.
Wishing you success in your trading career!
- t.me/finance_solutes
- Website: https://finance-solutes.com
- Hotline: +1 929 5636 439 ( Hotline )
- 26 Broadway, Suite 934, New York, 10004, US
