
 XM
XM Bybit
Bybit Binance
 Robinhood
 Webull
 IC Markets
 Pepperstone
 OKX
OKX Vantage
 VT Markets
 BingX
BingX Gate.io
 Kucoin
 MEXC
MEXC Exness
 Bitget
What is Fibonacci Retracement? A popular tool for traders is Fibonacci Retracements, also known as Fibonacci retracement, developed from the ideas of the Fibonacci sequence. The Fibonacci sequence follows the rule that each number is the sum of the two preceding ones. This article will help traders better understand the concept of Fibonacci retracement and how we can apply it in Forex trading effectively.
1. What is Fibonacci Retracement?
An interesting feature of this sequence is that each number in the series is approximately 1.618 times greater than the previous one. The value of 1.618 is known as the golden ratio of Fibonacci retracement. The golden ratio frequently appears in nature, art, etc. This common relationship between all the numbers in the sequence forms the foundation of the ratio used by technical traders to determine retracement levels.
There is no specific Fibonacci retracement formula in Excel. It is simply the percentage of any selected price range. The Fibonacci ratios will be discussed further below.
The Fibonacci retracement tool is commonly used by traders to draw support and resistance levels, set stop-loss orders, and establish target prices.

The Fibonacci sequence floats over the Atlantic coastline under our home spiral galaxy, The Milky Way, to the South. Long exposure with light painted text.
1.1. How it works
Fibonacci retracement levels are created by selecting two extreme points on the chart. Then, the vertical distance between these points is divided by the Fibonacci levels of 23.6%, 38.2%, 50%, 61.8%, and 100%. When these levels are determined, horizontal lines appear, which can be used to identify potential support and resistance levels.
The important Fibonacci ratio of 61.8% is found by dividing a number in the sequence by the next number. For example: 21 ÷ 34 = 0.6176, and 55 ÷ 89 = 0.61798.
The 38.2% Fibonacci ratio is discovered by dividing a number in the sequence by the number located two places to the right. For example: 55 ÷ 144 ≈ 0.38194.
And the 23.6% Fibonacci ratio is found by dividing a number in the sequence by the number located three places to the right. For example: 8 ÷ 34 ≈ 0.23529.
You may notice that 50% is not a ratio derived from the Fibonacci sequence but is still included because prices tend to reverse direction at significant levels.
1.2. How to Set Up Fibonacci Retracements on MT4 and TradingView
The Fibonacci retracement tool is provided on most popular trading platforms like TradingView and MetaTrader. This article will guide traders on how to set up Fibonacci retracements on MT4 and TradingView platforms.
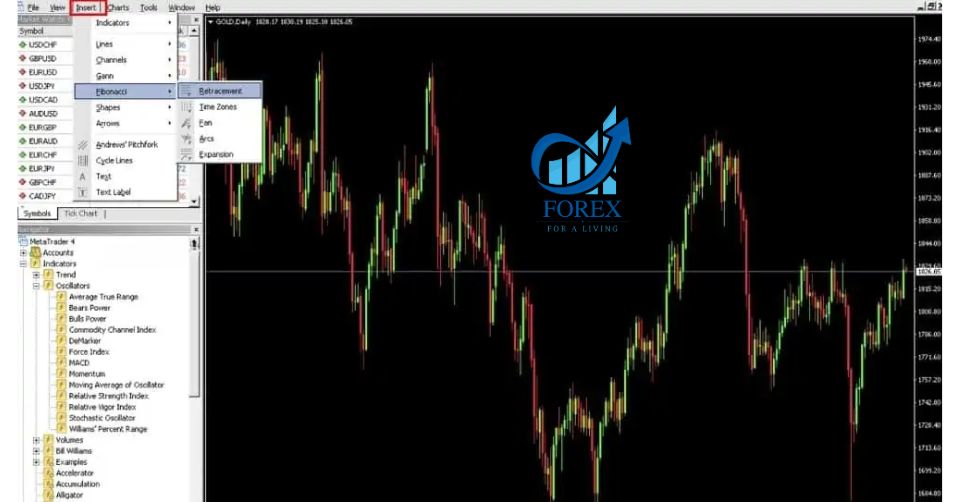
On MT4:
- Go to the Insert menu.
- Select Fibonacci and then choose Retracement.
The Fibonacci sequence follows this overall formula:
Xn+2=Xn+1+XnX_{n+2} = X_{n+1} + X_n
The Fibonacci sequence looks like this: 0, 1, 1, 2, 3, 5, 8, 13, 21, 34, 55, 89, 144,…
On the TradingView platform, you can find the Fibonacci retracement tool by looking at the toolbar on the far left side. Then, follow the steps as shown below:
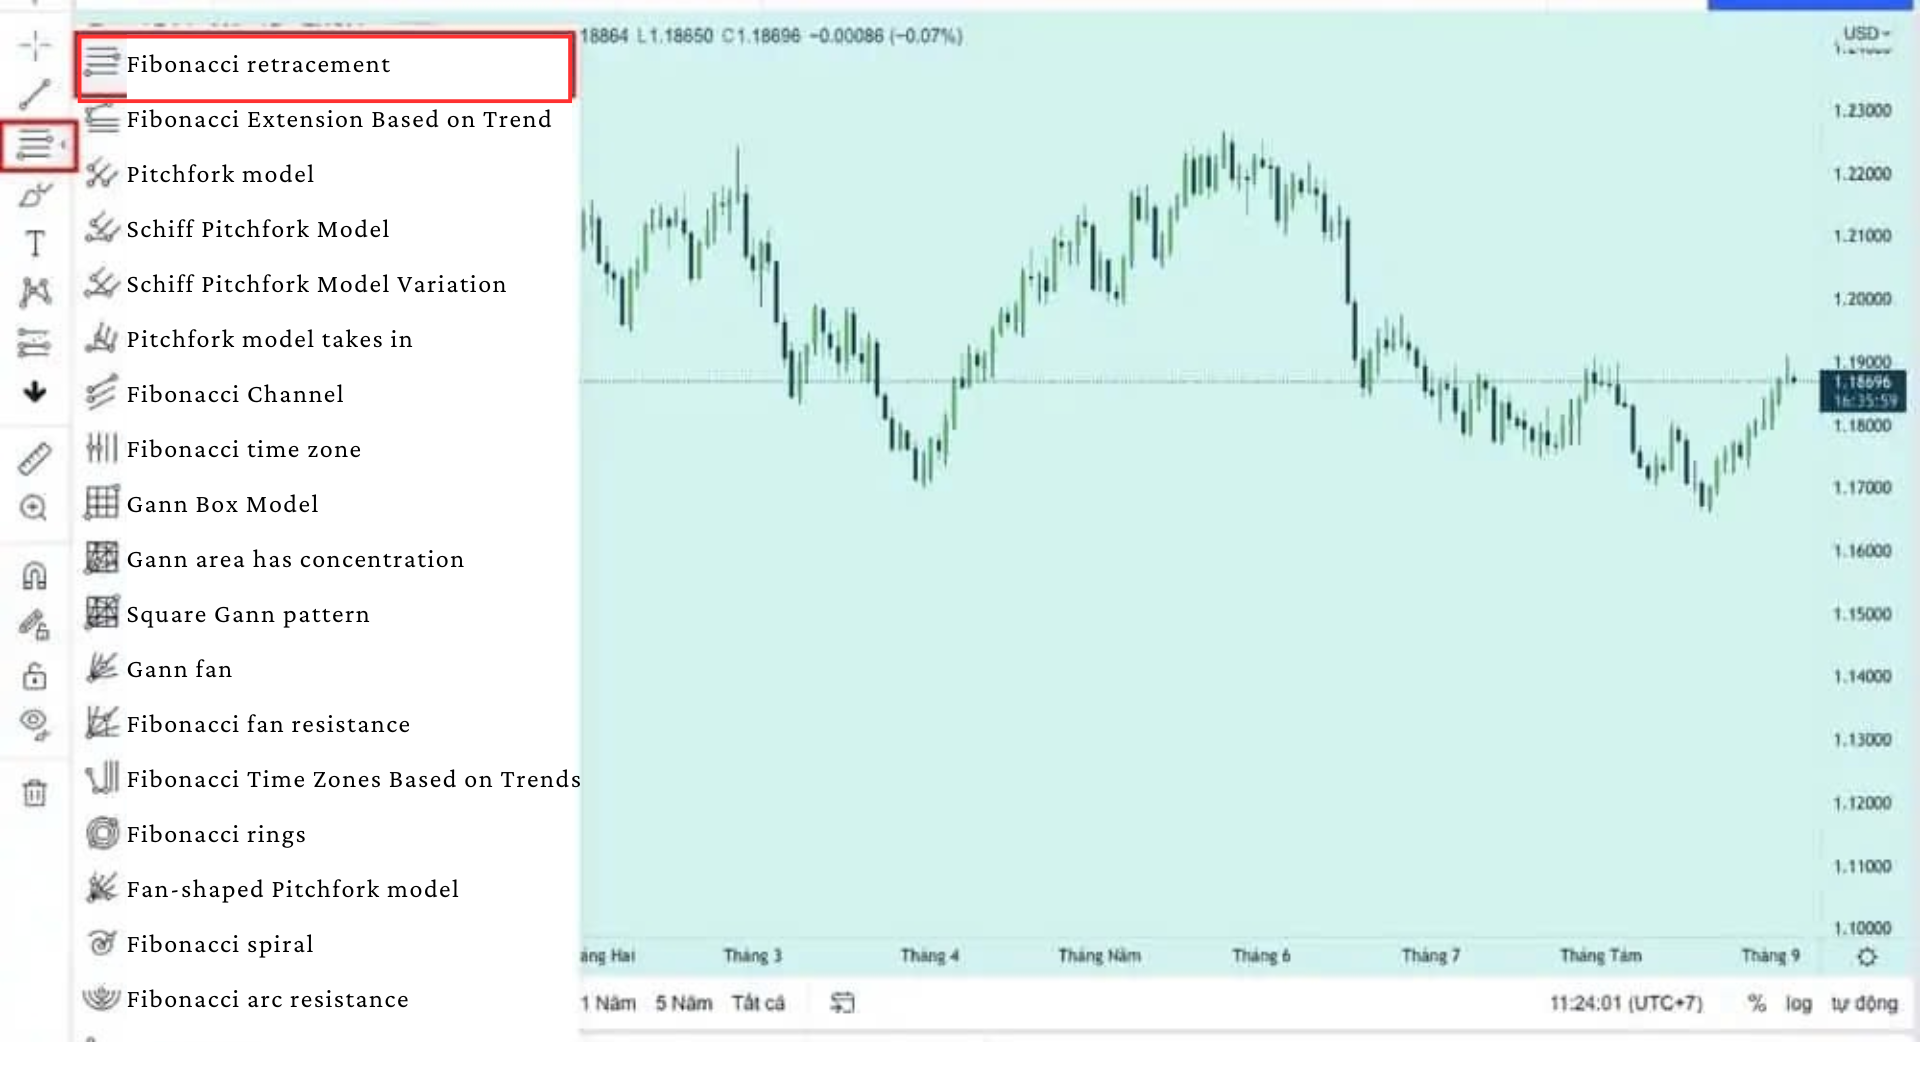
- HOW TO DRAW THE MOST ACCURATE FIBONACCI RETRACEMENT
To effectively use Fibonacci retracement in your trading strategy, traders must first know how to correctly draw the Fibonacci retracement on the chart.
2.1.1 Step 1: Identify the market trend
The first step is to look at the chart visually and see if the market is trending. This means the market is moving either up or down. If the price is moving in a sideways range, it is almost impossible to apply the Fibonacci tool effectively.
2.1.2 Step 2: Draw the Fibonacci retracement
Once you’ve identified the market trend, you can start drawing the Fibonacci retracement on the chart as follows: For an uptrend, you will draw the tool from the lowest point to the highest point of the trend period.
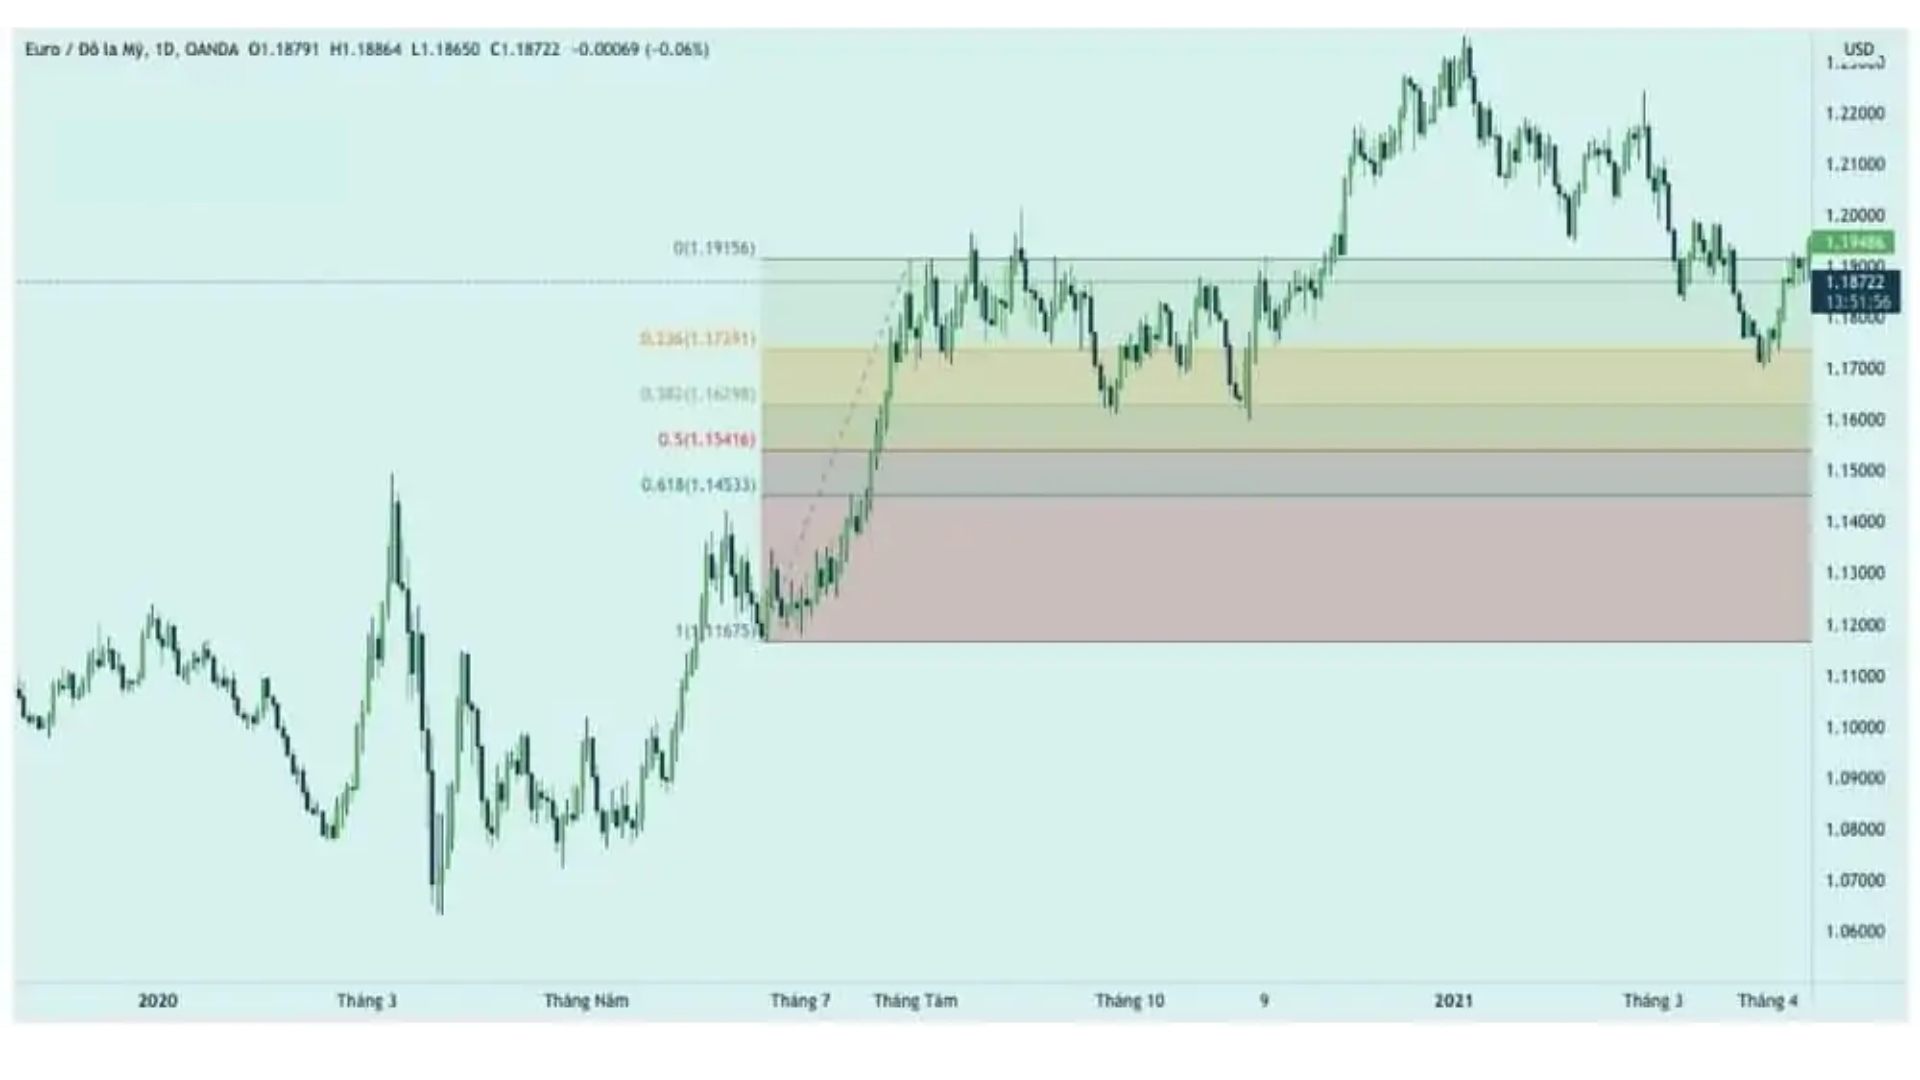
In an uptrend, the Fibonacci retracement levels are as follows: 1.0, 0.618, 0.5, 0.382, 0.286, and 0.0, listed from bottom to top. In this series of Fibonacci retracement levels, 0.0 is the highest point, and 1.0 is the lowest point of the uptrend.
On the other hand, for a downtrend, you would draw the Fibonacci retracement tool from the top down, that is, from the highest point to the lowest point. Here’s an example of Fibonacci retracement on the chart below:
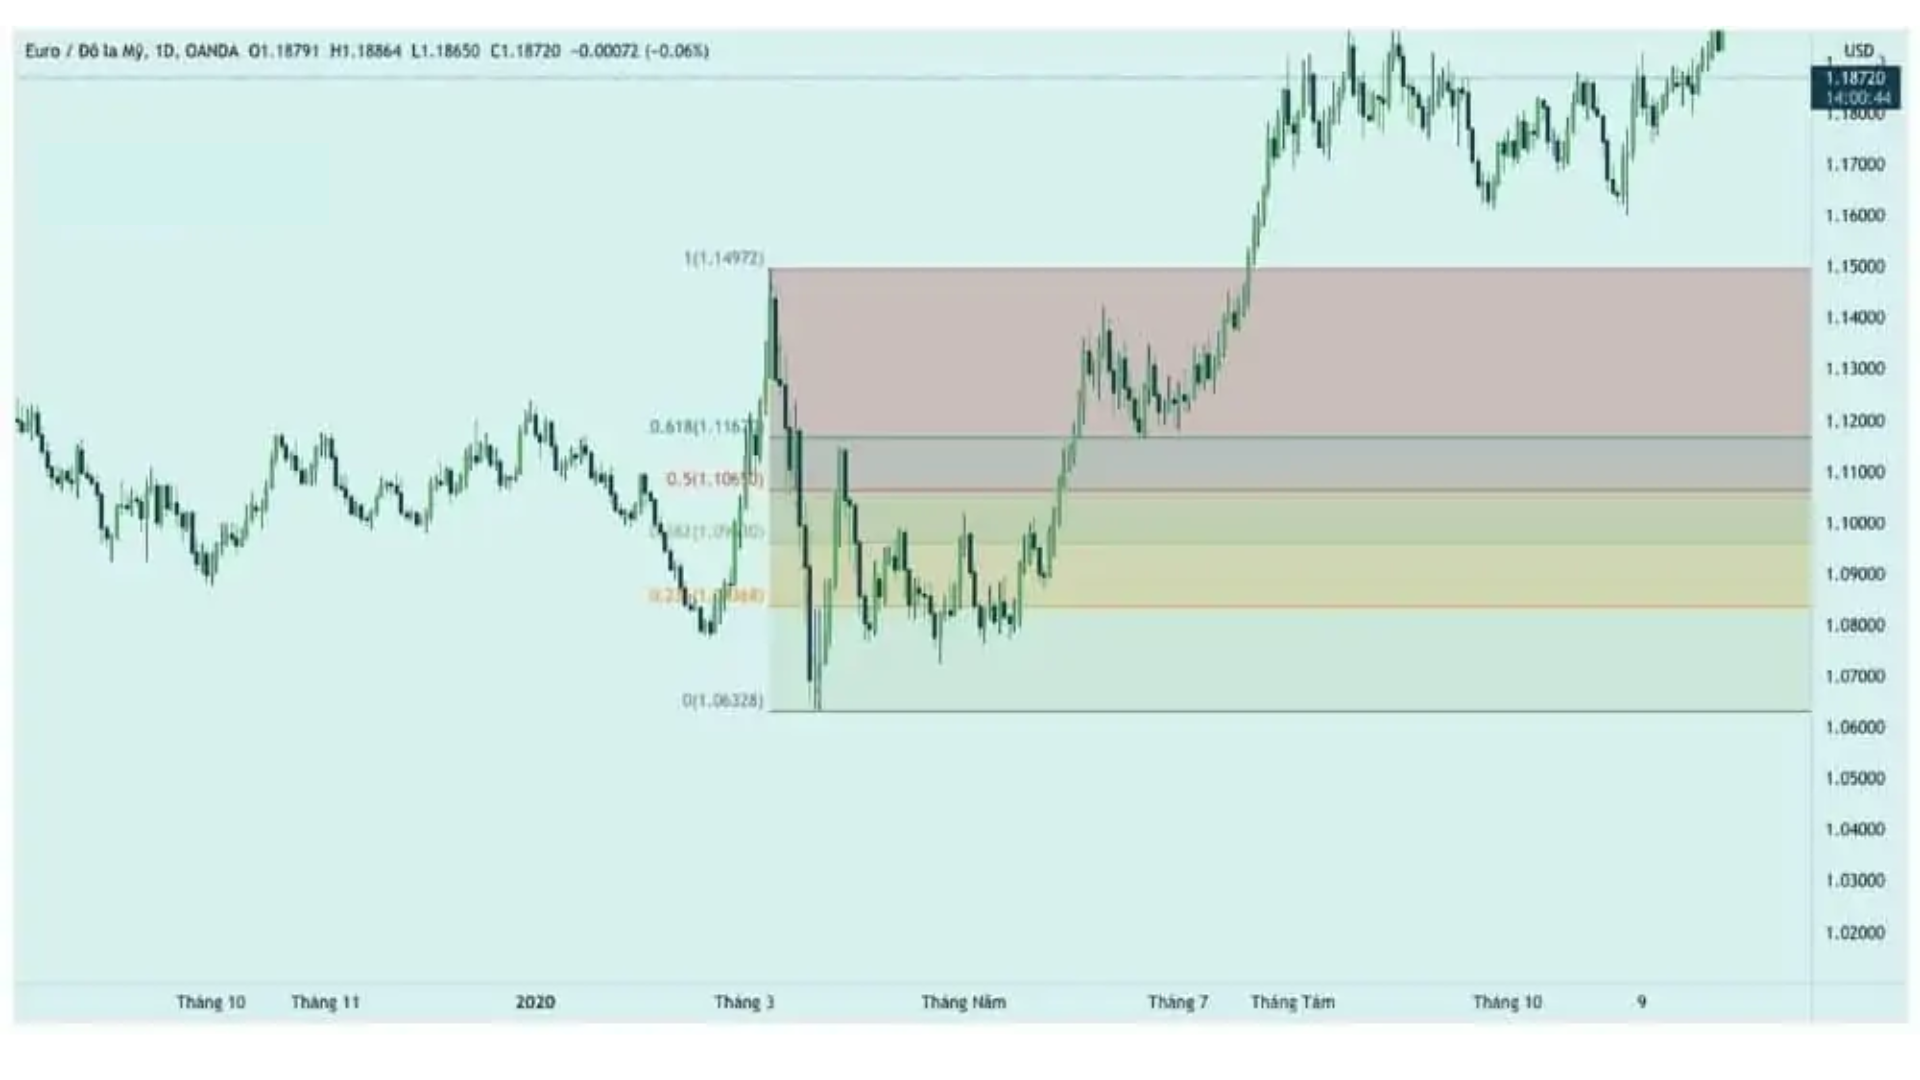
In a downtrend, the Fibonacci retracement levels are still the same as in an uptrend. However, in this case, 0.0 is the lowest level, and 1.0 is the highest point of the downtrend.
The 0.618 (61.8%) and 0.5 (50%) levels are considered the two most important levels in the Fibonacci retracement tool.
3. TRADING STRATEGY USING FIBONACCI RETRACEMENT
Basically, the market has two conditions: trend trading and range trading. In between, there is a “breakout” phase that temporarily pushes the price range to form a new trend.
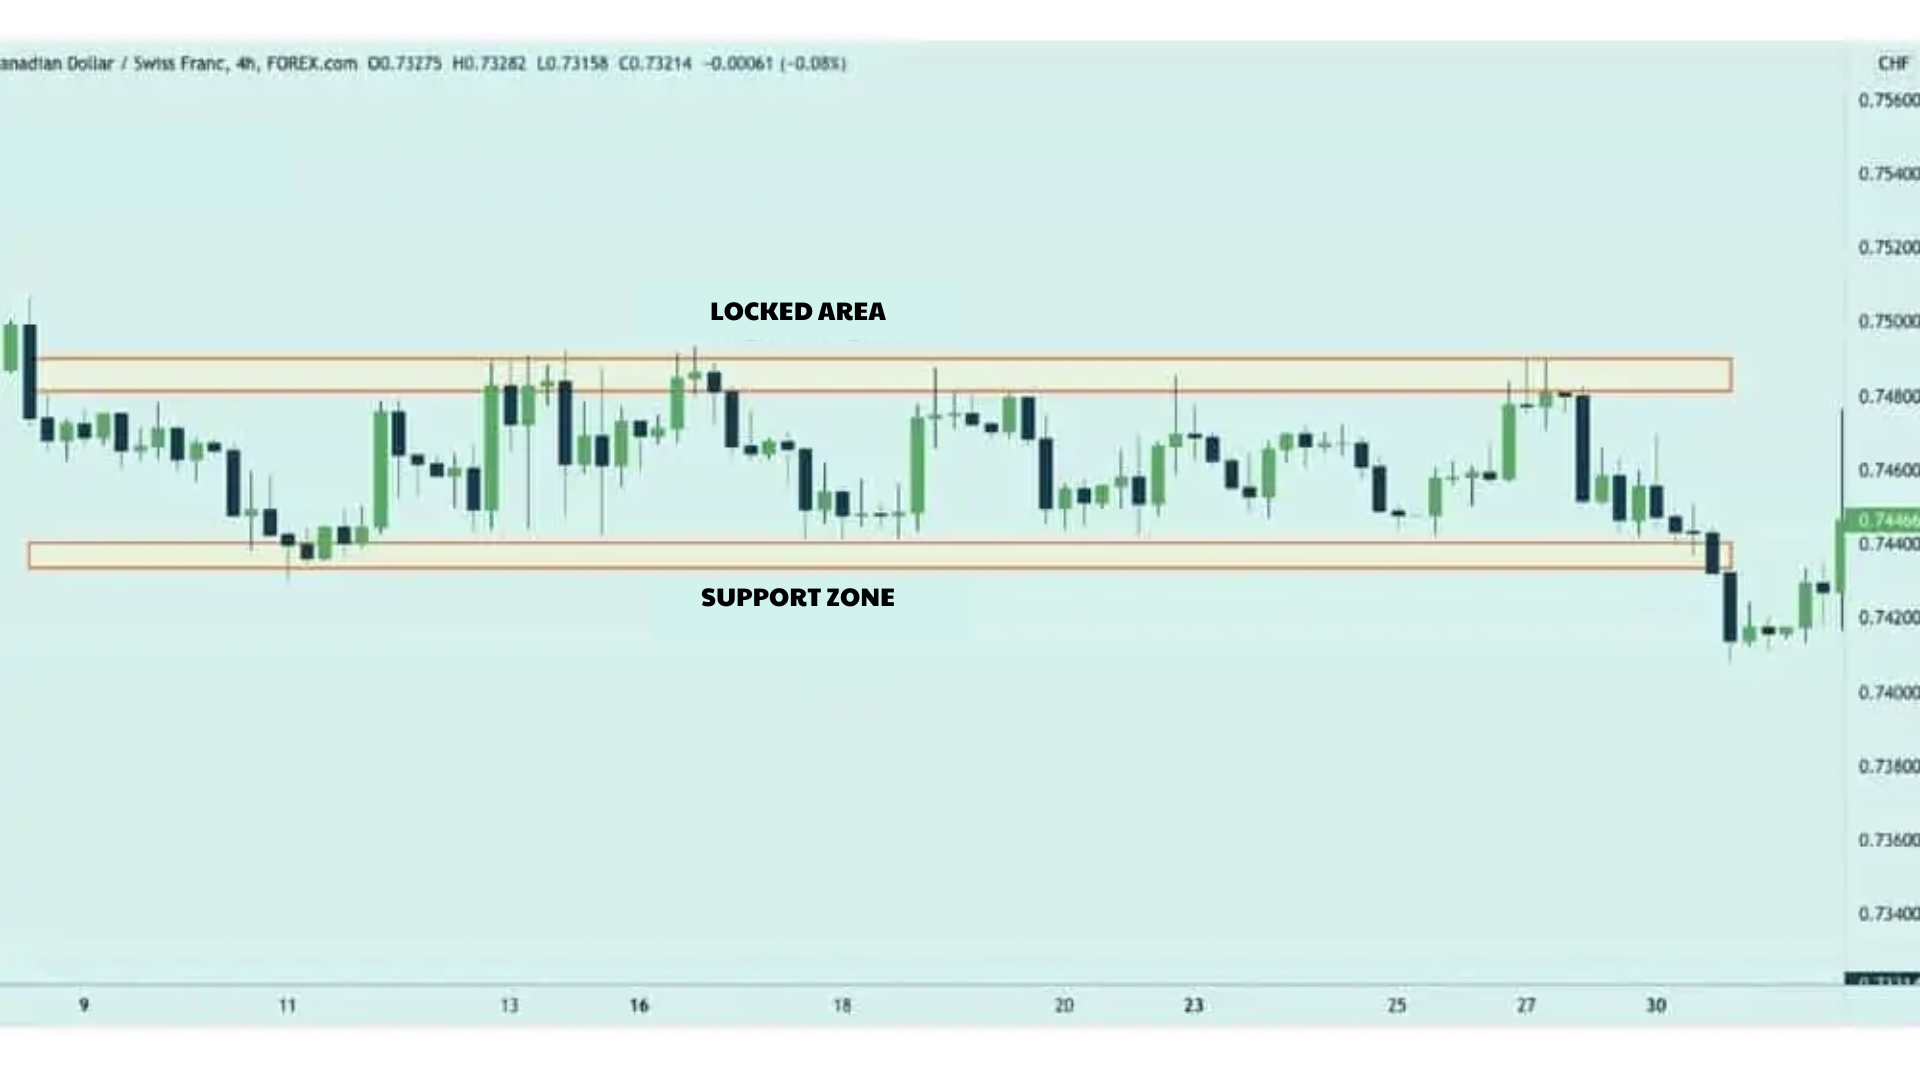
It is important not to be complacent about the possibility of breakouts above or below the range. Traders should use available risk management tools and other risk management techniques.
3.1. Range Trading with Fibonacci Retracement
When an asset experiences a significant rise or fall, it creates a large move that may cause the market to trend sideways. The price may retrace partially or fully from the initial move.
Fibonacci levels can provide signals around potential support or resistance areas, where such sideways movement may occur.
Let’s take a look at the daily GBP/USD chart below:
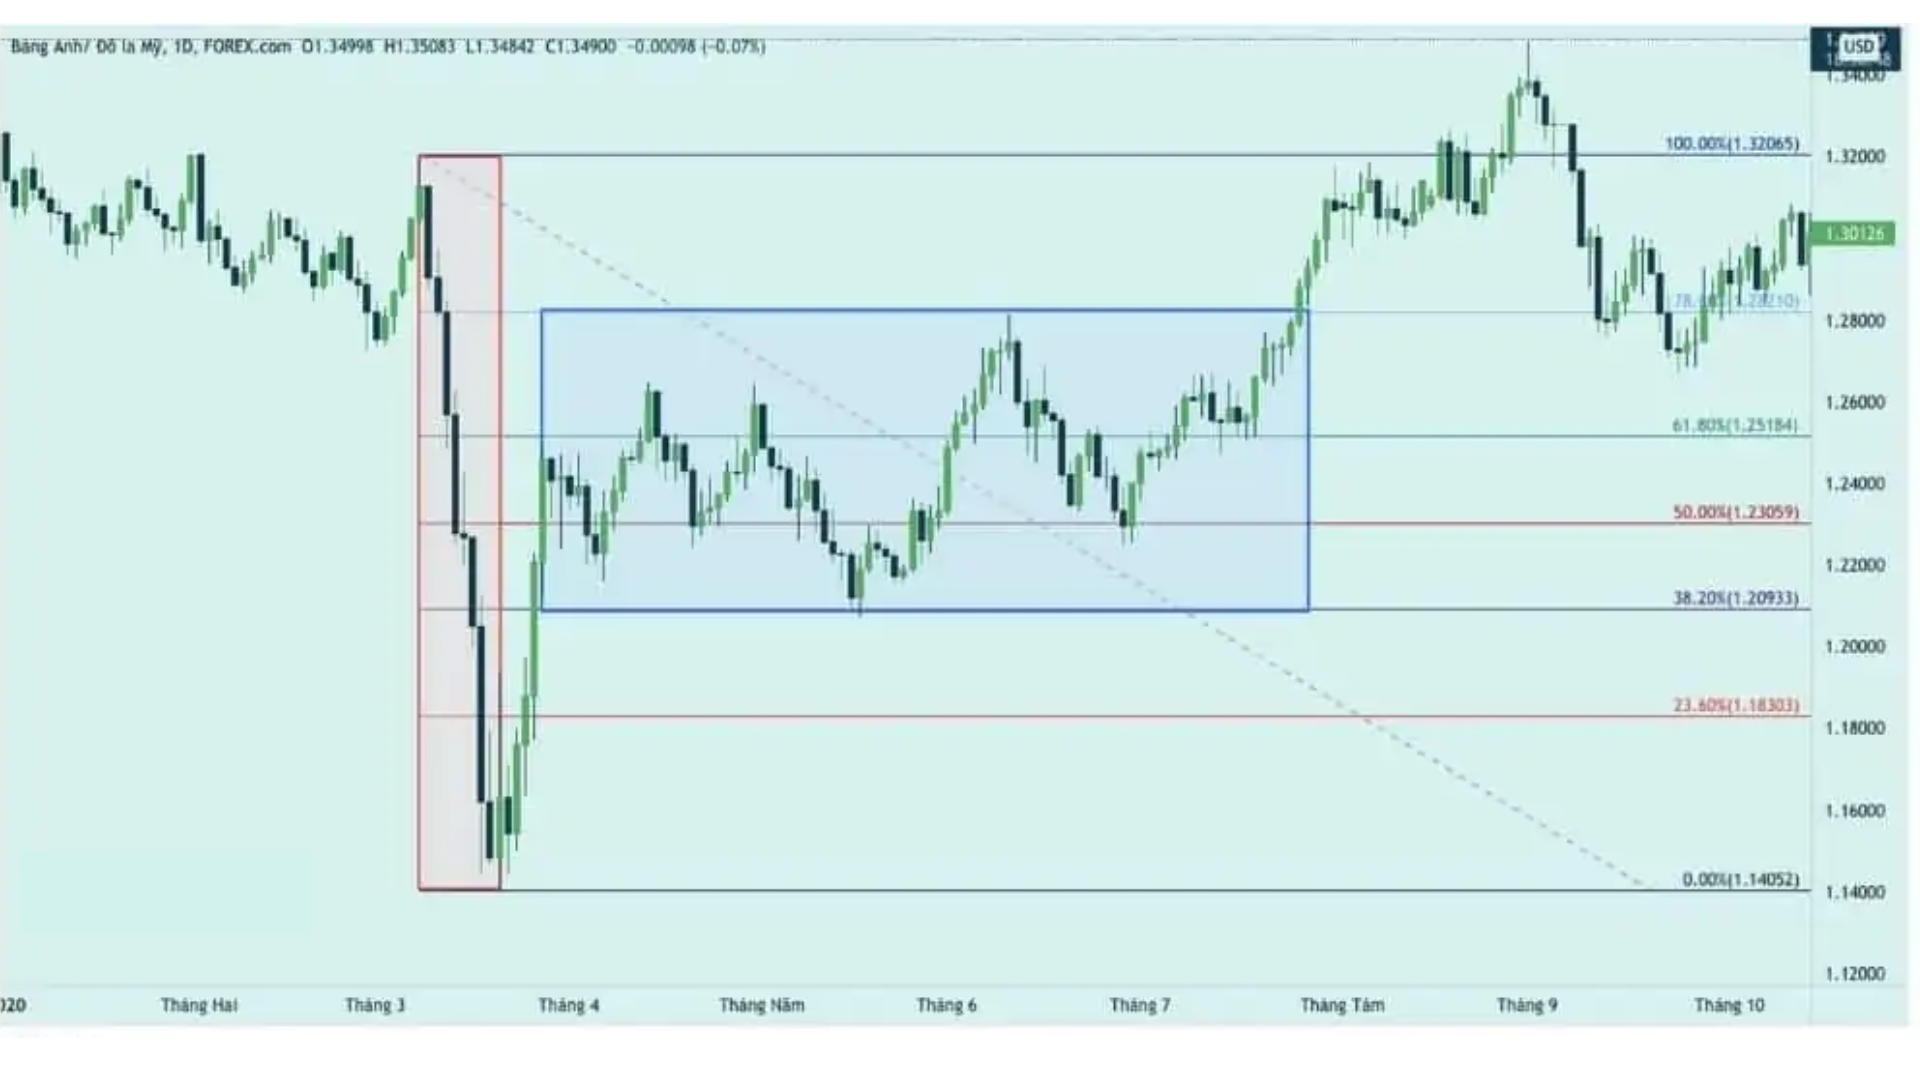
From left to right, we can clearly see a series of peaks and troughs, indicating the initial downtrend. Then, a strong pullback occurs, retracing more than 50% of the previous major move. After that, the price action transitions into a range-bound market.
Combining the resistance around the previous level of 1.2641 helped further define the trading range, highlighting that multiple reversal points developed at these retracement levels over the following four months. You can see support around the 61.8% retracement, which clarified higher highs and higher lows, ultimately leading to a breakout to the upside for the GBP/USD pair.
In a range-bound market, the trader’s goal is often to focus on risk levels by relying on the continuation of the trading range. As mentioned earlier, if the range is about to break, traders might want to look for ways to minimize losses since the market conditions they were anticipating may no longer apply.
Note: The support levels at both the 38.2% and 50% retracement levels showed support at different points within the range, helping to maintain higher lows after the price retraced lower.
3.2. Breakout Trading with Fibonacci Retracement
Using Fibonacci retracement to identify key resistance levels allows traders to track price breakouts by observing whether the price breaks above or below.
Take a look at the GBP/USD chart below. It shows a potential breakout opportunity using Fibonacci retracement levels.
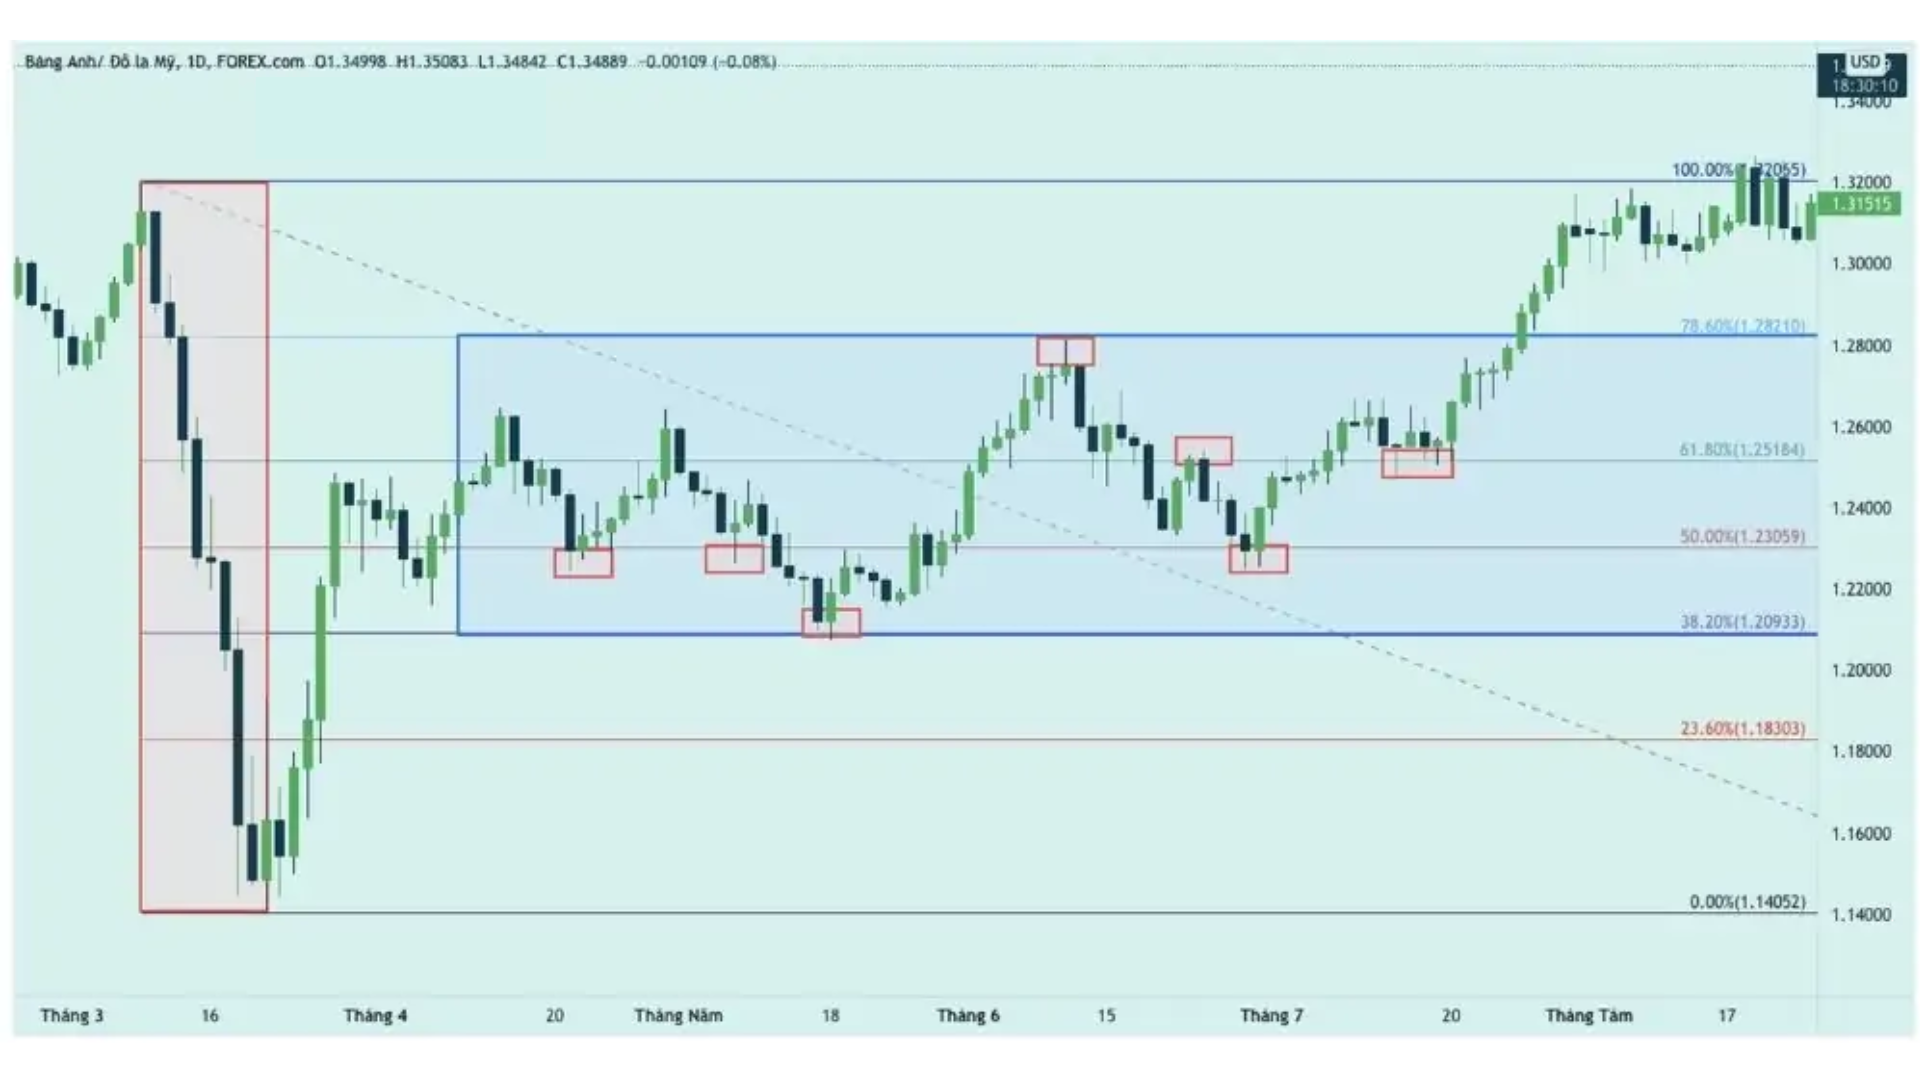
After a major price movement, the price action transitions into a range-bound market. Once the long-term picture is established, traders can focus on smaller timeframes to gain further details.
In mid-July, on the right side of the chart, buyers began to take control, evident by a retracement and a support level around the 61.8% Fibonacci retracement level.
At that point, the buyers remained dominant, forcing a breakout at the 76.4% retracement level, which had previously held as resistance. After the breakout, buyers continued to push the price higher, leading to a new short-term uptrend.
There are two ways to execute this strategy. The first method is to search for the primary trend. The second method is to look for mean reversion opportunities.
With trend-following strategies, traders aim to capitalize on the primary trend by looking for confirmation factors that the trend will continue. On the other hand, traders who engage in range trading try to take the opposite approach; they look to sell after a bullish breakout from resistance or buy after a bearish breakout from support.
The temporary state between a range and a new trend is called a breakout, where the price escapes the range and moves strongly into a new trend. As a result, speculating on breakouts can be risky since, in essence, traders are anticipating a reversal of the current trend.
Thus, risk management should be tight, along with a well-thought-out analysis plan that identifies potential support or resistance levels. This will allow traders to implement the right strategy, with Fibonacci tools being valuable in this process.
4. FIBONACCI RETRACEMENT COMBINED WITH OTHER TOOLS
When used correctly, the Fibonacci Retracement levels can help traders identify potential support and resistance levels based on past price action. The first combination I want to introduce is combining Fibonacci retracement with support and resistance.
4.1. Combining Fibonacci Retracement with Support and Resistance in Trading
Fibonacci levels are often used to identify support and resistance levels. For Fibonacci retracement, the simplest and most popular trading strategy is to combine it with support and resistance levels. This can be done by determining whether key Fibonacci retracement levels align with significant support and resistance levels.
When a support or resistance level coincides with a key Fibonacci retracement level, that level becomes a very strong barrier. The likelihood of price bouncing from that level increases significantly.
When the price is in an uptrend, it often pulls back slightly before continuing the trend. Typically, it will retrace to key Fibonacci levels, such as 38.2% or 61.8%. Let’s take a look at an example of how to combine the Fibonacci tool with support and resistance levels:
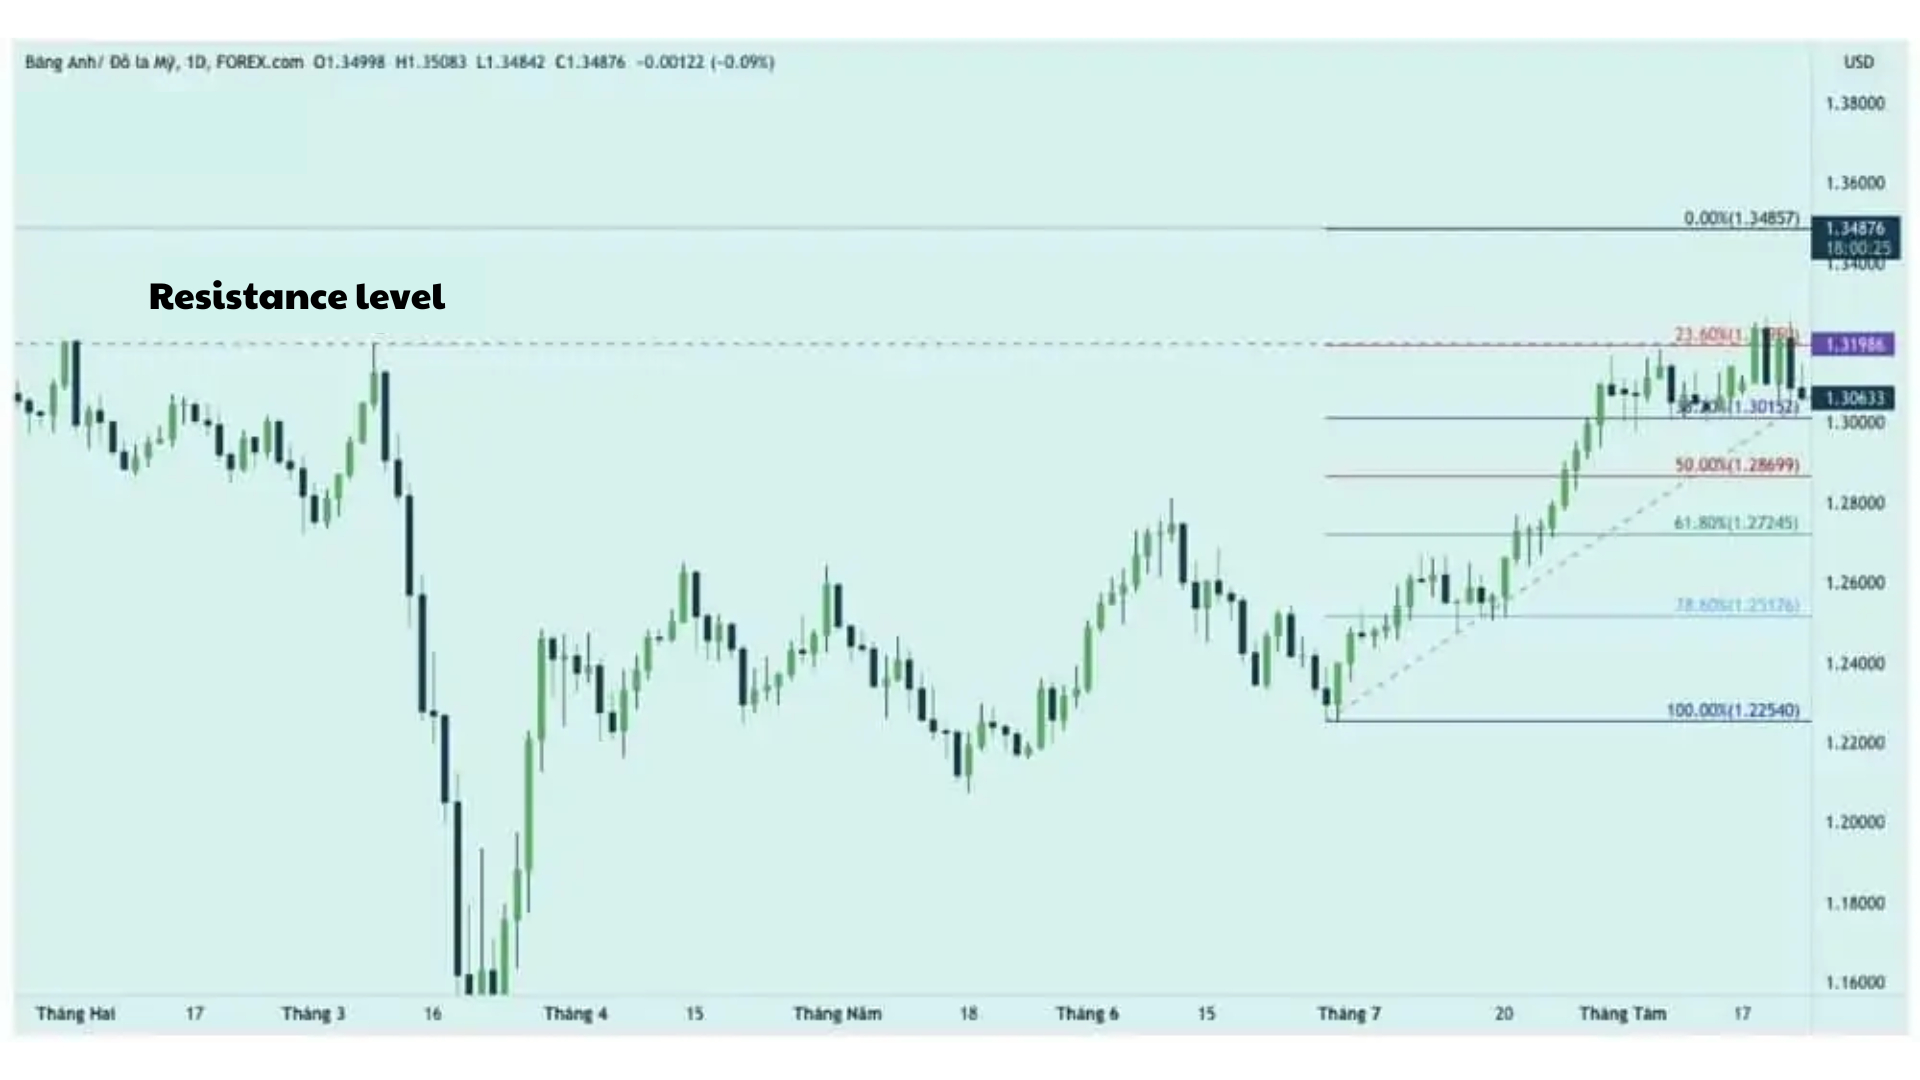
As seen in the image, there are two resistance levels coinciding with two Fibonacci retracement levels: 23.6% and 61.8%. The resistance at the Fibonacci 61.8% level has been tested multiple times but could not be broken, making this a strong resistance level. After the price touches this level, it bounces back and continues the upward trend. Both of these levels prove to be strong resistance levels.
Traders can enter a sell order when the price breaks the resistance at the Fibonacci 23.6% level. Alternatively, traders can enter a buy order when the price breaks the previous 61.8% resistance (which may turn into support), but fails to maintain the break and forms a candlestick closing above this level.
4.2. Combining Fibonacci Retracement with Trendlines
This strategy can be applied to any financial market and in any time frame, depending on the trader. In Forex trading, this strategy takes advantage of price pullbacks within the current trend.
The idea behind this strategy is that when important Fibonacci retracement levels lie above a trendline, they can serve as potential entry points. At these levels, the price tends to bounce back and continue in the direction of the prevailing trend, rather than reversing.
4.2.1. Setup for Buy
In an uptrend, traders primarily look for buy opportunities. Pay attention to the retracement levels where the price touches the trendline. After the price touches the trendline, it should pause and then resume the previous trend.
However, if the price breaks the trendline and continues to surpass important Fibonacci levels such as 50%, 61.8%, or 78.6%, this indicates that the trend might be broken. In such cases, this trading strategy will no longer be valid, and traders should look for another position, as the main trend has changed.
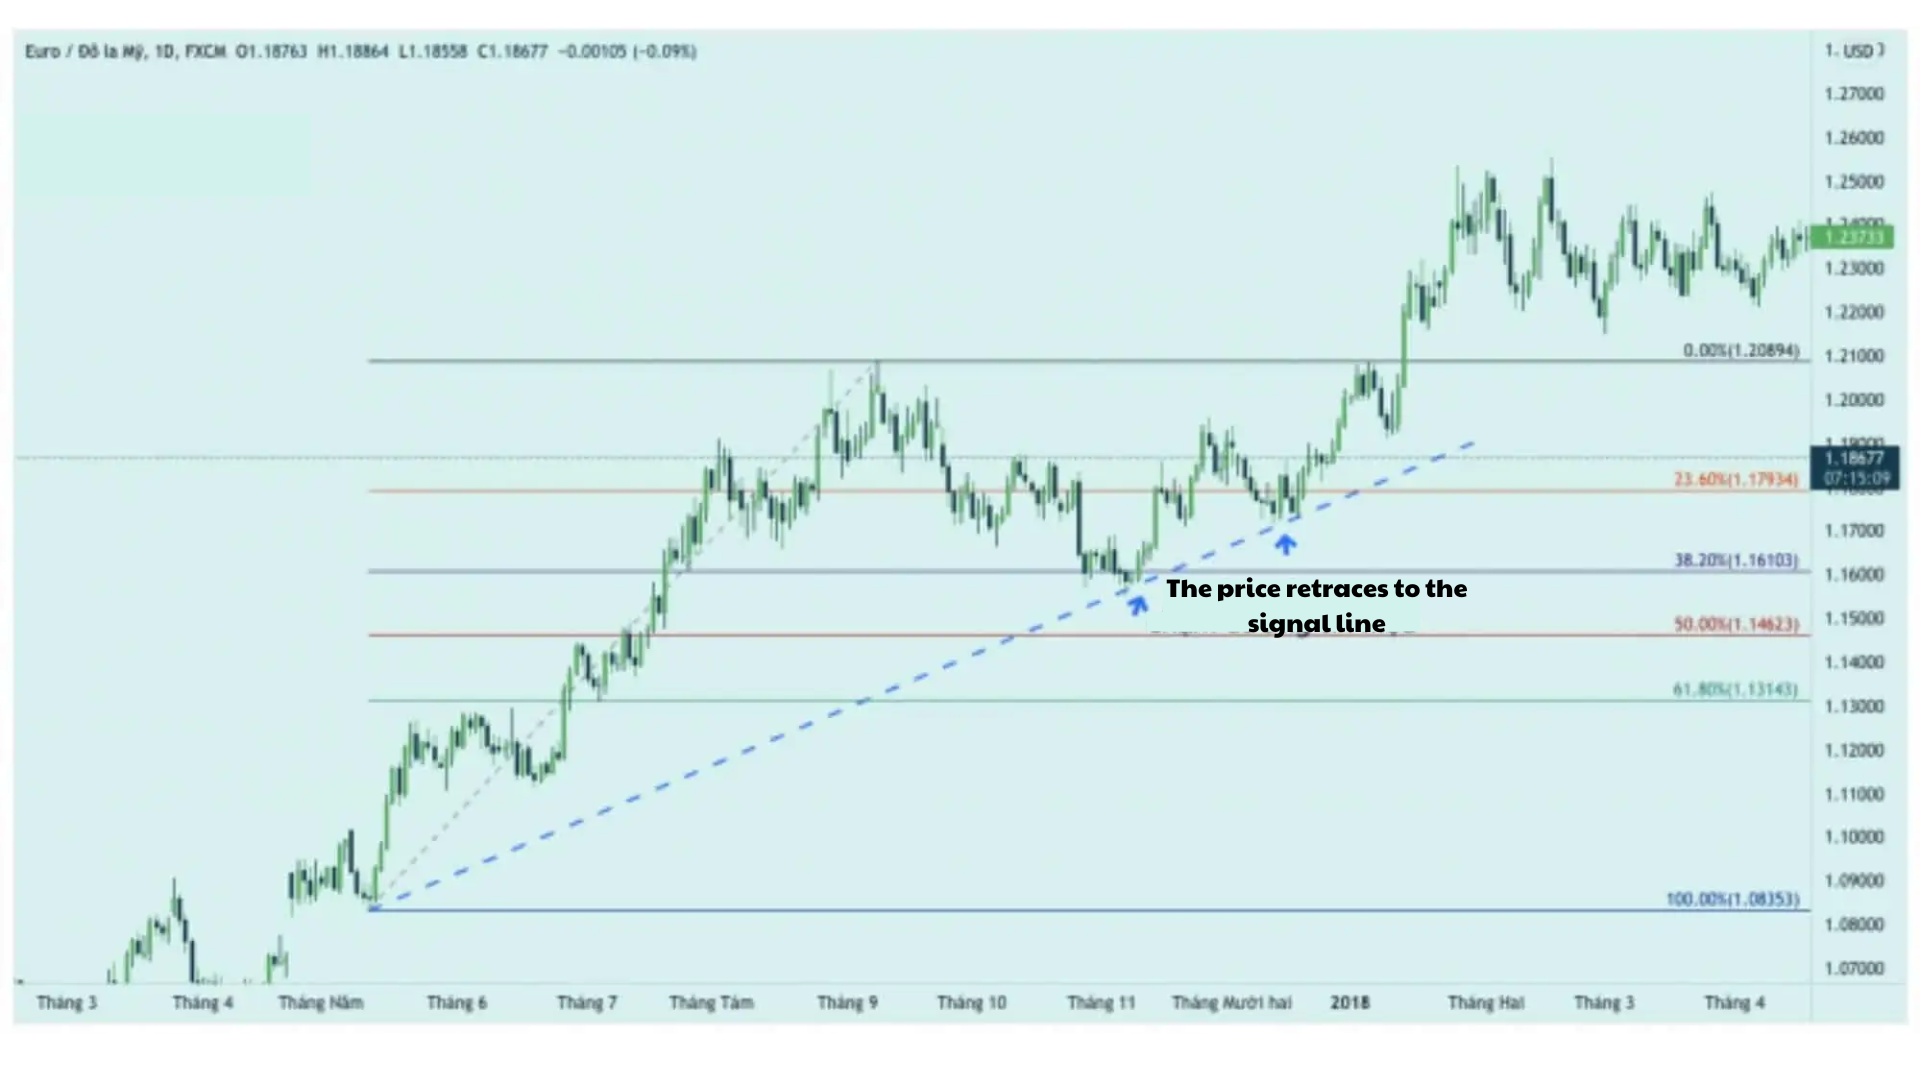
In the image above, we can see that the price has retraced and tested the 38.2% level for a while before touching the trendline and eventually returning to the dominant trend. Once you notice this, you can look for an entry point. Wait for the price to close above the 38.2% level and then enter a buy order.
Note: If the price touches the trendline and the trendline is between the 50% and 61.8% levels, we will wait for a candlestick to close above the 50% level before entering a trade.
4.2.2. Sell Setup
The sell setup is essentially the opposite of the buy setup. We typically look for sell setups in a downtrend. Some trading rules still apply in the sell setup, just like in the buy setup.
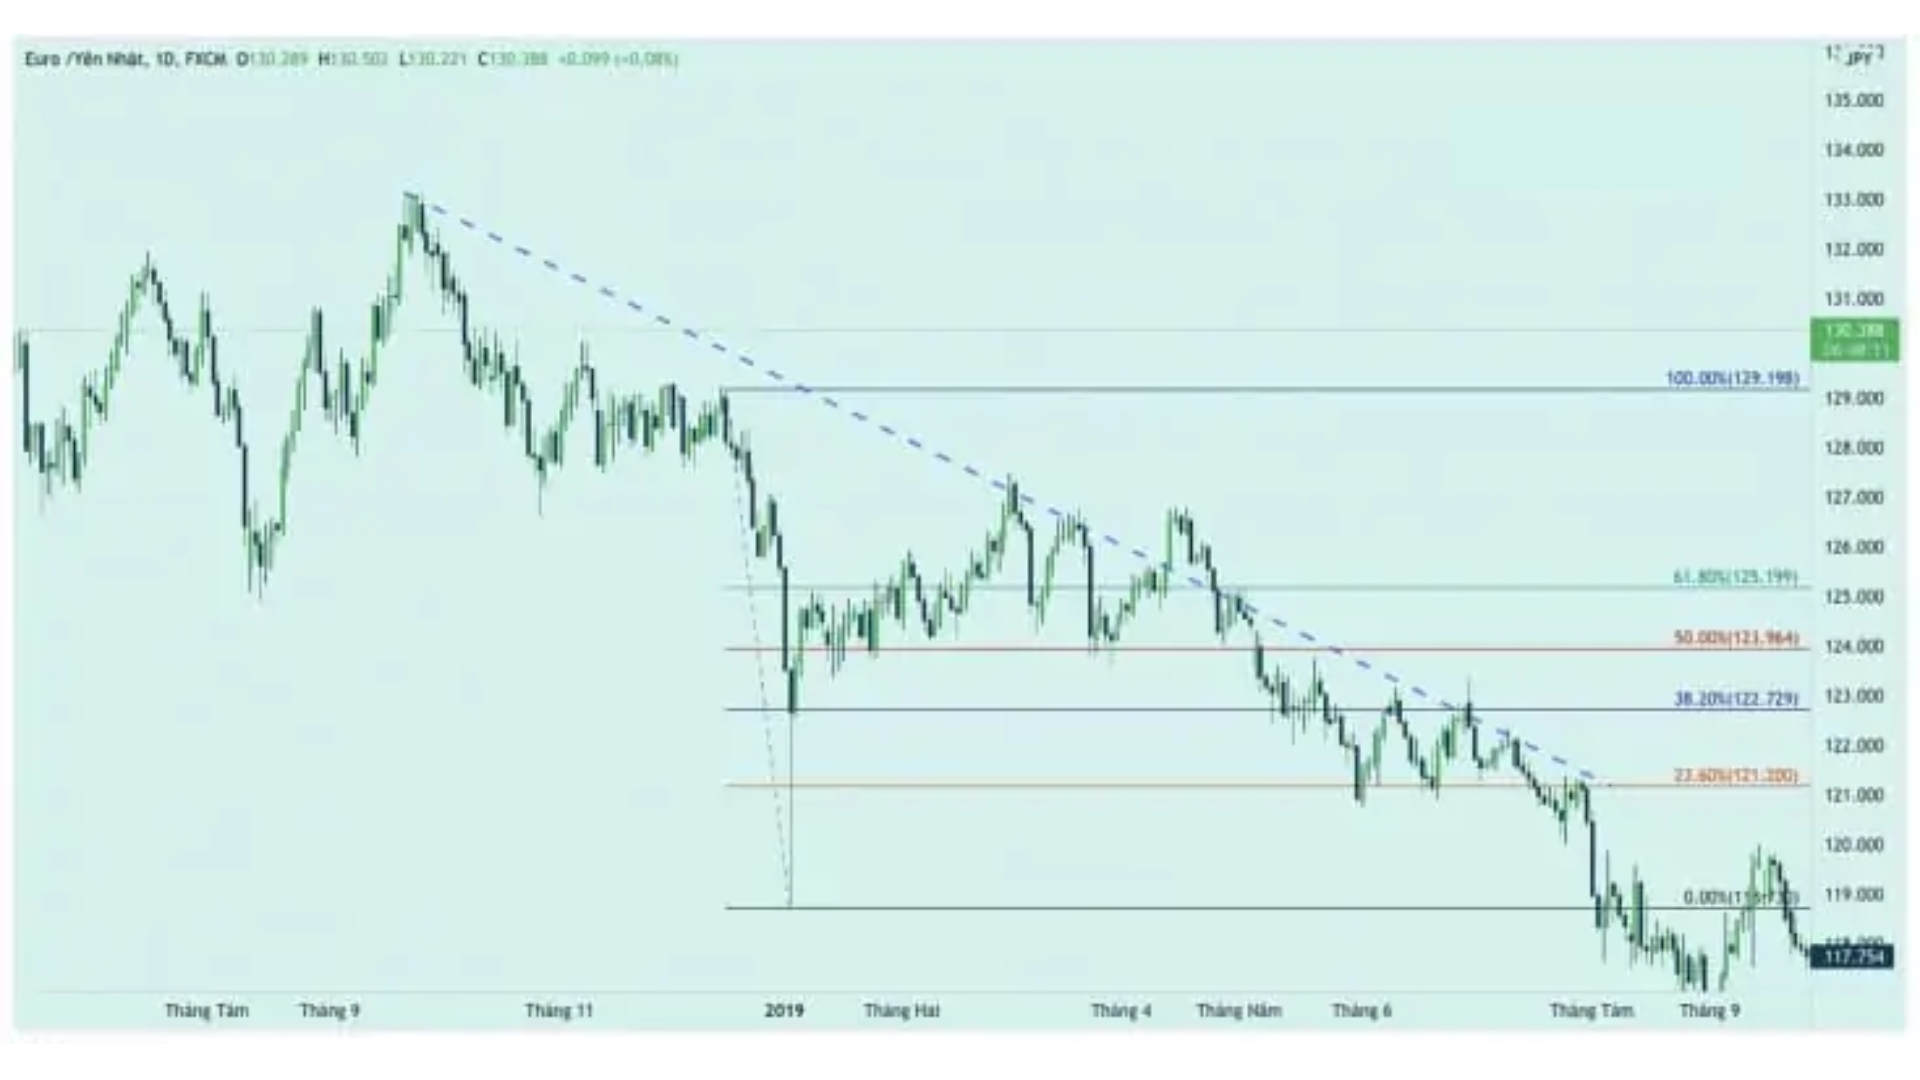
After drawing the Fibonacci retracement and trendline, we will also wait for the price to bounce and touch the level, or in other words, test the trendline. To be sure, wait for the price to form a candlestick that closes below the 50% or 38.2% level, and then enter a sell order.
4.3. Fibonacci Retracement with Candlestick Patterns
The Fibonacci retracement levels 38.2%, 50%, and 61.8% act as potential support areas where traders will wait for reversal candlestick signals from a downtrend to an uptrend to enter a buy order in the current uptrend.
Note: You need to wait for a candlestick reversal signal from a downtrend to an uptrend at the support levels formed by the above Fibonacci retracement levels.
Here are some candlestick reversal patterns from down to up that you can combine:
- Hammer pattern
- Bullish Engulfing pattern
- Morning Star pattern
- …
In cases where multiple Doji candlestick patterns form and test the Fibonacci retracement support levels of 38.2%, 50%, or 61.8%, these Doji patterns are also considered signals that these support levels will hold strong.
When you see these candlestick patterns at the above support zones, you can place a buy order following the current uptrend in the market.
To better understand this trading strategy, let’s look at a real example on the daily chart of the XAUUSD pair:
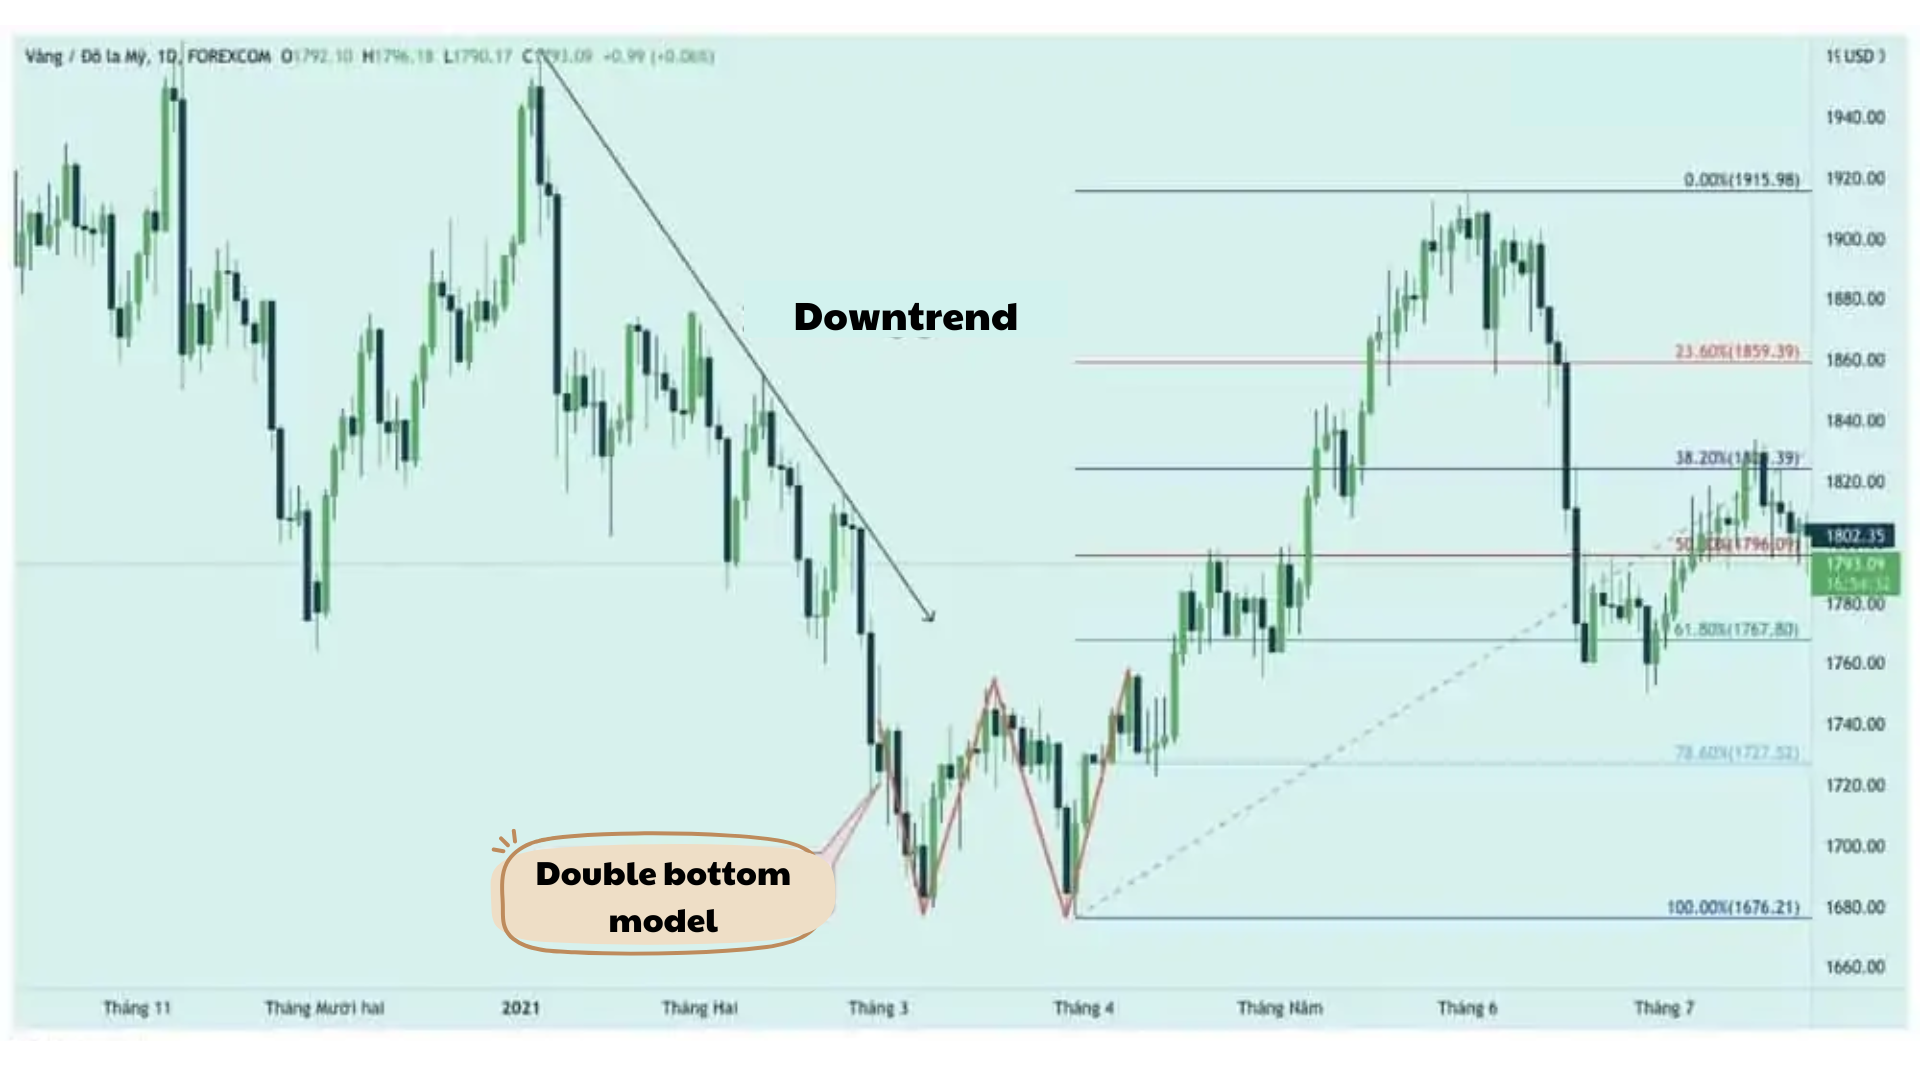
In a downtrend, the XAUUSD daily chart formed a Double Bottom pattern. This pattern signals the end of the downtrend and the potential start of a new trend (which could be a sideways range or an uptrend).
Looking at the example above, we can see the swing highs and lows of this trend:
- Swing Low: Located at 1677
- Swing High: Located at 1917
Using the Fibonacci retracement tool on this uptrend, the Fibonacci starting point is placed at the Swing Low and dragged to the Swing High. Once plotted, pay attention to the important Fibonacci levels: 38.2%, 50%, and 61.8%.
After reaching the Swing High, XAUUSD formed a Bearish Engulfing pattern and dropped to the 23.6% level before bouncing back. However, rather than continuing upwards, XAUUSD failed to break the Swing High and reversed downwards.
In this downward move, the price broke through the 38.2% and 50% levels, eventually stopping at the 61.8% Fibonacci level.
At the 61.8% level, you can see that the price reacted to this zone multiple times and formed an Inside Bar candlestick pattern at this key support region. This indicates that selling pressure was diminishing, and a reversal could occur. The 61.8% level could be considered a potential support zone. After several reactions at the 61.8% level and the formation of the Inside Bar pattern, the price reversed strongly upwards.
You could enter a trade right after the candlestick reversal pattern appears at the potential Fibonacci levels. As seen on the chart, after the Inside Bar appeared at the 61.8% level, the price reversed and moved up to the 38.2% level.
4.4. Combining Fibonacci Retracement with RSI
When new traders are learning about Fibonacci levels, one question they often ask is, “How do I know which Fibonacci levels are important to focus on?” You can use the Relative Strength Index (RSI) to help confirm whether a Fibonacci retracement level is being respected.
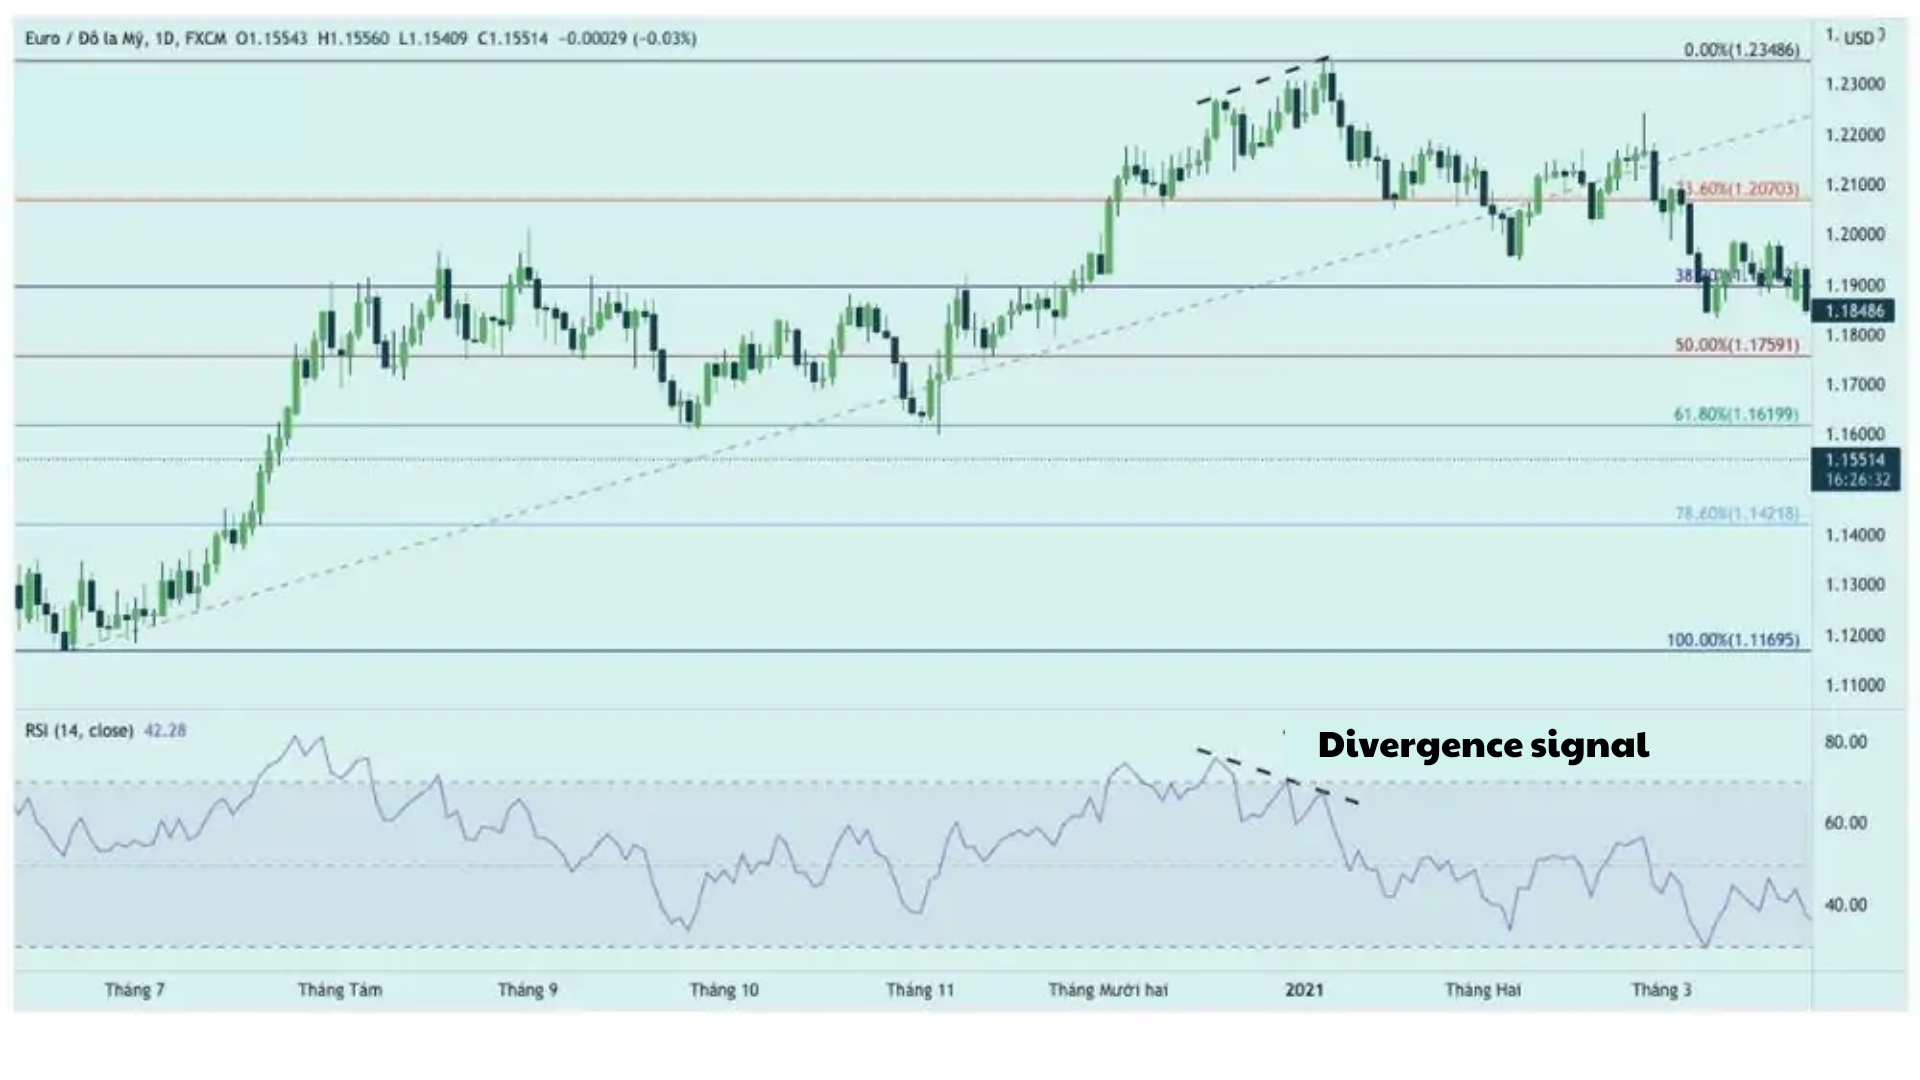
Let’s take a look at a practical example on the EURUSD daily chart.
In a downtrend, the XAUUSD daily chart formed a Double Bottom pattern. This pattern signals the end of the downtrend and the potential start of a new trend (which could be a sideways range or an uptrend).
Looking at the example above, we can see the swing highs and lows of this trend:
- Swing Low: Located at 1677
- Swing High: Located at 1917
Using the Fibonacci retracement tool on this uptrend, the Fibonacci starting point is placed at the Swing Low and dragged to the Swing High. Once plotted, pay attention to the important Fibonacci levels: 38.2%, 50%, and 61.8%.
After reaching the Swing High, XAUUSD formed a Bearish Engulfing pattern and dropped to the 23.6% level before bouncing back. However, rather than continuing upwards, XAUUSD failed to break the Swing High and reversed downwards.
In this downward move, the price broke through the 38.2% and 50% levels, eventually stopping at the 61.8% Fibonacci level.
At the 61.8% level, you can see that the price reacted to this zone multiple times and formed an Inside Bar candlestick pattern at this key support region. This indicates that selling pressure was diminishing, and a reversal could occur. The 61.8% level could be considered a potential support zone. After several reactions at the 61.8% level and the formation of the Inside Bar pattern, the price reversed strongly upwards.
You could enter a trade right after the candlestick reversal pattern appears at the potential Fibonacci levels. As seen on the chart, after the Inside Bar appeared at the 61.8% level, the price reversed and moved up to the 38.2% level.
4.4. Combining Fibonacci Retracement with RSI
When new traders are learning about Fibonacci levels, one question they often ask is, “How do I know which Fibonacci levels are important to focus on?” You can use the Relative Strength Index (RSI) to help confirm whether a Fibonacci retracement level is being respected.
Let’s take a look at a practical example on the EURUSD daily chart.
As we can see in the chart above, the Fibonacci Retracement tool has been applied to the EURUSD pair. Pay attention to the important Fibonacci retracement levels: 38.2%, 50%, and 61.8%.
We can observe that the 50% level is providing a support zone, while the 38.2% level is providing a resistance zone. Additionally, the RSI indicator is showing a divergence, which is a signal that the price is likely to reverse.
Divergence occurs when the price forms higher highs, but the RSI oscillator forms lower highs. This divergence indicates that momentum is slowing down, presenting a trading opportunity for traders.
5. Conclusion
Use the Fibonacci retracement tool as a confirmation tool, not as the sole deciding factor for entering a trade. This is because no tool in the market is perfect. To strengthen your trading decisions, combine it with other tools and implement a proper risk management strategy.
In addition to the Fibonacci combinations mentioned above, another common combination is Fibonacci retracement and Elliott waves.
I hope this article has provided you with a better understanding of this trading method. It also gives you new combinations of Fibonacci retracement and other tools to add to your trading system.
Wishing you successful and smooth trading!
- t.me/finance_solutes
- Website: https://finance-solutes.com
- Hotline: +1 929 5636 439 ( Hotline )
- 26 Broadway, Suite 934, New York, 10004, US
