
 XM
XM Bybit
Bybit Binance
 Robinhood
 Webull
 IC Markets
 Pepperstone
 OKX
OKX Vantage
 VT Markets
 BingX
BingX Gate.io
 Kucoin
 MEXC
MEXC Exness
 Bitget
In the article about Bollinger Bands, we have understood and seen the effects it brings. Continuing the series of forex knowledge, today we will discuss a strategy using Bollinger Bands: the Double Bollinger Band strategy. This strategy is particularly effective in assessing momentum and volatility in price action.
1. DOUBLE BOLLINGER BAND STRATEGY
1.1. How does the Double Bollinger Band strategy work?
Double Bollinger Bands use two Bollinger Bands indicators to filter entry and exit points. This strategy aims to enter buy (sell) orders when the price breaks above (below) the standard deviation. Double Bollinger Bands can be applied to both trending markets and range/sideways markets; it can be used as a breakout strategy or when assessing the momentum of an existing trend.
All you need to do is add two Bollinger Bands indicators; here are the suggested settings for these two indicators. Note that these are just personal views from Forex; you can certainly modify them to fit your trading strategy.
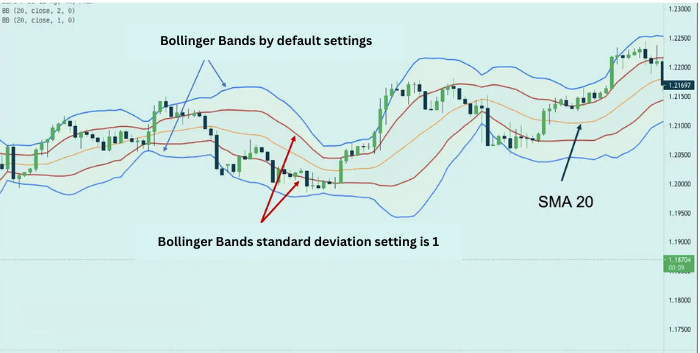
- Bollinger Bands with default settings (period: 20, standard deviation: 2). The period here refers to the period of the Simple Moving Average (SMA).
- Custom Bollinger Bands settings (period: 20, standard deviation: 1). Still using the 20-period Simple Moving Average, but adjust the standard deviation to 1.
Below is the chart interface after adding the two Bollinger Bands indicators:
1.2. Which Timeframe Should Be Used?
The Double Bollinger Band strategy can be applied on any timeframe, but it is best used on a daily or higher timeframe. The reason is that it is easier, safer, and provides more profits. Also, never think that you will make more money by applying it to lower timeframes like 5 minutes or 15 minutes.
Trading on such low timeframes will only give you headaches, increase the risks, and create a constant need to check your charts without helping you make more profits. Many traders only check their charts 15–30 minutes a day but still make much more profit than those who check the charts every 5 or 15 minutes.
2. DOUBLE BOLLINGER BAND IN FOREX
The two most common strategies when applying the Double Bollinger Band strategy in forex trading are the breakout strategy and the trend-following strategy, which will be explained further below.
2.1. Breakout Trading Strategy
The Double Bollinger Bands strategy can be applied when trading breakouts from an existing trading range by observing whether the price breaks above or below that range, combined with a strong breakout to the buy or sell zone of the Double Bollinger Bands (DBB). Seeing an additional strong breakout helps forex traders strengthen their view of the upcoming price trend and avoid false breakouts.
Here is an illustrative example of this strategy. This is a chart of the EUR/GBP pair. Look at the end of the trading range; there is a breakout above the upper band of the Bollinger Bands with a standard deviation of 1 — the red line. At this point, traders should wait for the price to break out of the range and reach the DBB buy zone, with strong momentum.
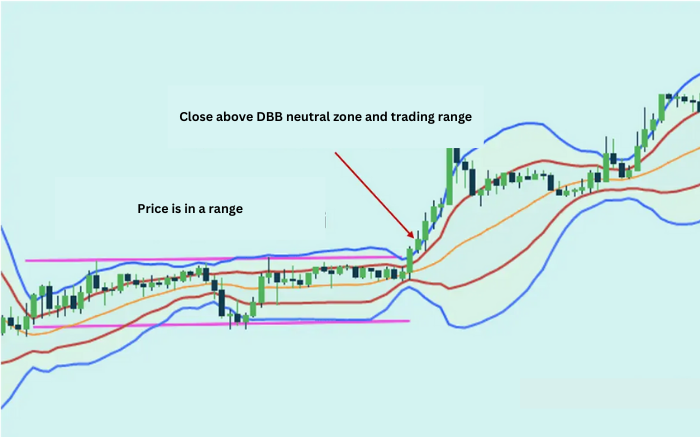
When seeking additional confirmation, traders may observe that the breakout occurs during an expansion of the Bollinger Bands, after a period of relatively low volatility.
The green candlestick shown above is a necessary confirmation of a breakout and indicates a strong buy signal. To minimize risk, traders can place a stop loss at the 20 SMA line, with the take-profit level set at a key resistance level to maintain a positive risk-to-reward ratio.
2.2. Trend-following Trading Strategy
The Double Bollinger Band trend-following strategy allows traders to assess the momentum of an existing trend. It enables traders to exit positions when momentum decreases or enter positions when momentum and volatility increase.
The example below considers the EUR/GBP chart after the price broke out. The price even breaks both the upper Bollinger Bands. As long as the price remains in the buy zone and above the 20 SMA line (the yellow line), traders can maintain buy positions. The exit position could be at the closing price below the middle band or when the price breaches the neutral zone and moves toward the sell DBB zone. This exit position depends on the individual’s risk tolerance.
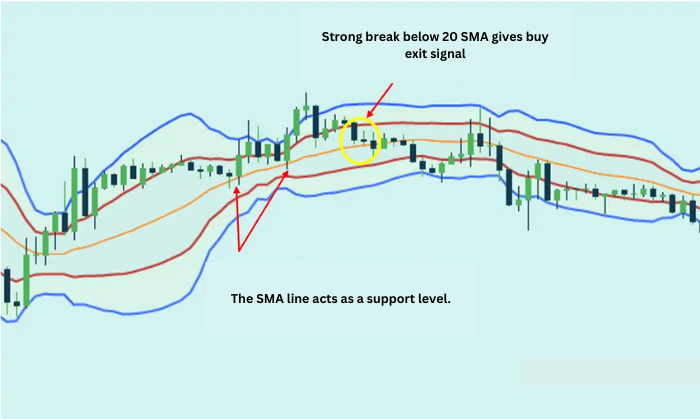
Those who use the middle line as a stop-loss point can move the stop loss along the 20 SMA line as the price increases.
3. 4 RULES IN THE DOUBLE BOLLINGER BAND STRATEGY
Rule 1: Sell When the Price Is In or Below the “Sell Zone” of Double Bollinger Bands
The “Sell Zone” of the Double Bollinger Bands is the lower zone, bounded by the green and red Bollinger Bands (the two lower Bollinger bands).
Note: The colors of the Bollinger Bands can be customized to individual preferences.
As long as the price remains in or below the two lower bands, the downward momentum is strong enough for traders to trust that the trend is likely to continue.
When the price drops into this zone, it serves as a signal (waiting for confirmation) to enter new sell positions and maintain them until the price shows a decisive (confirmed) movement above this zone. At that point, exit the trade and take profits.
Rule 2: Buy and Maintain Buy Positions When the Price Is In or Above the “Buy Zone”
The “Buy Zone” of the Double Bollinger Bands is the upper zone, bounded by the red and green Bollinger Bands (the two upper Bollinger bands). As long as the price remains in or above the two upper bands, the momentum is strong enough that the price is likely to continue rising. This is the time to enter new buy positions. Exit the trade and take profits when the price moves below this zone.
Rule 3: Do Not Trade Using Double Bollinger Bands When the Price Is in the Neutral Zone
The Neutral Zone is the area bounded by the two red Bollinger Bands. When the price is in this zone, the momentum is not strong enough to risk trading in the direction of the trend. You should refrain from trading until there is evidence combined with another solid signal indicating that the trend (momentum) could continue upwards or downwards.
Instead, traders may choose to wait for a clearer and more reliable entry opportunity, or until the momentum is strong enough.
Rule 4: Minimize Risk – Enter Buy Positions at the Bottom of the Buy Zone and Sell Positions at the Top of the Sell Zone
This rule aims to minimize risk by buying at the bottom and selling at the top while following a strong trend. When trading in a strong trend, a promising trade could suddenly turn into a large loss. This rule is not easy to execute. Success depends on how well you understand other technical evidence and signals, as well as your ability to balance between seizing profit opportunities and avoiding market traps that could lead to losses.
These are the general concepts of the Double Bollinger Band strategy that traders should be aware of, along with the 4 important rules to follow. We wish you successful trading, and don’t forget to follow other posts on Forex!
- t.me/finance_solutes
- Website: https://finance-solutes.com
- Hotline: +1 929 5636 439 ( Hotline )
- 26 Broadway, Suite 934, New York, 10004, US
