
 XM
XM Bybit
Bybit Binance
 Robinhood
 Webull
 IC Markets
 Pepperstone
 OKX
OKX Vantage
 VT Markets
 BingX
BingX Gate.io
 Kucoin
 MEXC
MEXC Exness
 Bitget
What is Bollinger Bands? In this article, I will show you everything about this technical indicator so you can understand and apply it most effectively. Bollinger Bands is a technical trading tool that can be applied to all financial markets, including stocks, forex, commodities, and futures contracts.
Bollinger Bands can be used in most timeframes, from very short timeframes to longer ones such as hourly, daily, weekly, or monthly charts.
The only requirement is to have sufficient liquidity to observe the price formation mechanism working in each candle. While it can be widely applied, it is particularly effective in forex trading.
1. WHAT ARE BOLLINGER BANDS?
To understand what Bollinger Bands are, you need to know about the person who created them, John Bollinger. He developed the Bollinger Bands as a solution to identify relative highs and lows in a flexible market. The indicator itself consists of an upper band, a lower band, and a moving average line. The significance of Bollinger Bands is to identify the highs and lows in the market, helping traders choose the right buy and sell points in line with their trading strategies.
The two trading bands correspond to the two standard deviations above and below the moving average (usually 20 periods). Using two standard deviations indicates that 95% of price data will fall within these two bands.
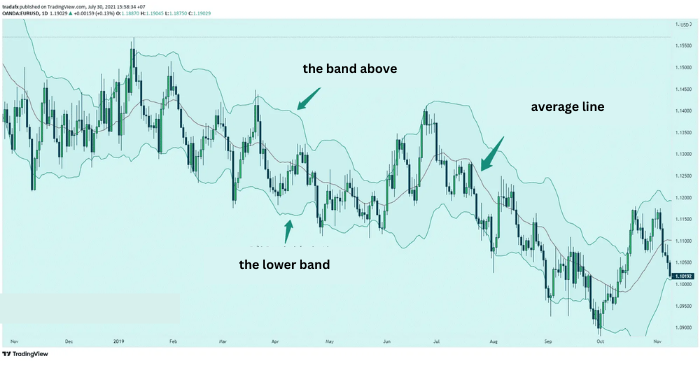
According to general rules, the price is considered overbought when it touches the upper band and oversold when it touches the lower band.
When the price fluctuates between the upper and lower bands, Bollinger Bands become an excellent tool for evaluating volatility. When the bands contract, the market experiences less volatility, which is a great signal to apply a range trading strategy.
Similarly, Bollinger Bands will expand when the market becomes more volatile. During these times, traders can use breakout strategies or trend-based strategies.
1.1. Bollinger Band Formula:
Bollinger Bands are primarily formed from the price moving average (Moving Average), also known as the MA line. This indicator uses 3 MA lines combined into a specific formula as follows:
Upper Band = SMA (20) + (Standard Deviation of 20-day price x 2)
Middle Band = SMA (20)
Lower Band = SMA (20) – (Standard Deviation of 20-day price x 2)
2. INSTRUCTIONS FOR SETTING UP BOLLINGER BAND ON MT4
Bollinger band is an indicator that comes with the MT4 software when you download and install it on your computer, and it is completely free. Therefore, follow the instructions to set up this indicator below.
Method 1: Set up on the Navigator panel
- Open the MT4 software.
- Look at the Navigator panel on the left corner, click on Indicator -> Trend -> Select Bollinger Band.
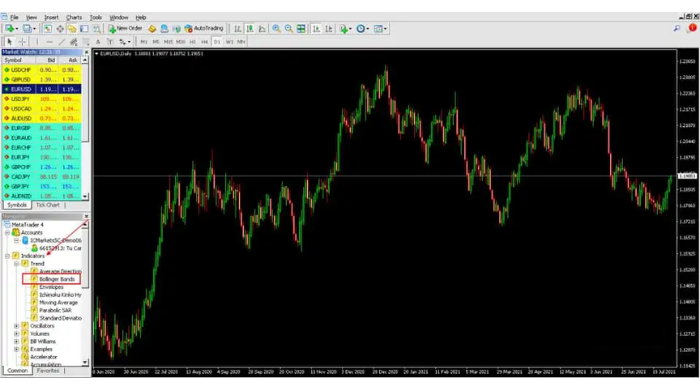
- Then a settings window will appear.
- Change the following parameters: In the Parameter tab, you will find basic settings such as Period (number of periods), Deviation (deviation), Apply to Close (Apply the closing price for calculation).
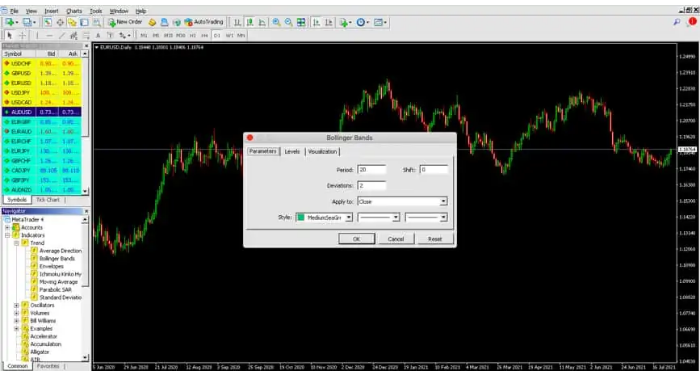
- You can also adjust the colors, thickness of the Bollinger Bands, or modify the time frame in the Levels and Visualization tabs next to it.
Many traders adjust the settings they find suitable, but according to Forex view, you should keep the default settings.
- After clicking OK, your chart will look like this:
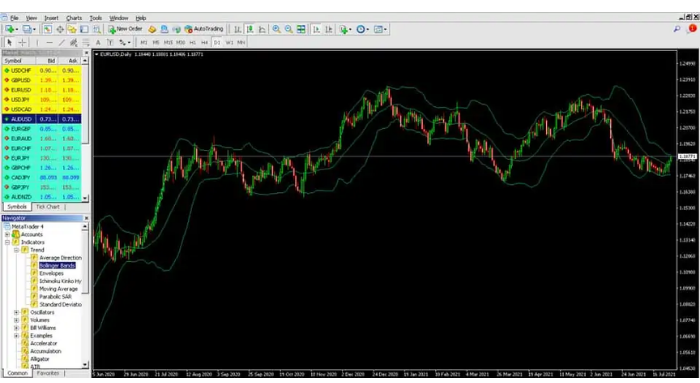
Method 2: Simple setup on the Toolbar
- Look at the Menu bar, under the List section (see the image) -> Trend -> Bollinger Bands.
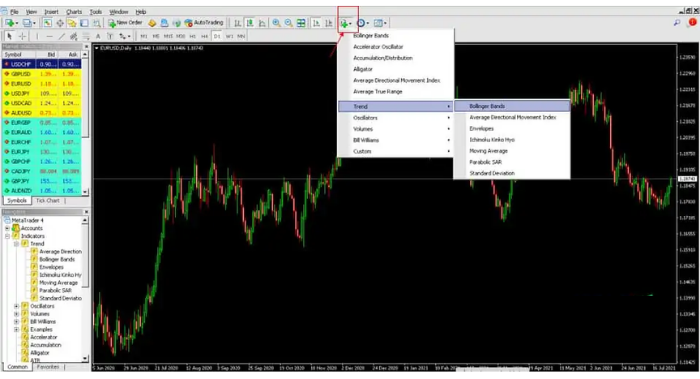
- When the settings window appears, follow the same steps as Method 1.
Method 3: Set up on the Menu bar
- Look at the Menu bar -> Select Insert -> Indicator -> Trend -> Bollinger Bands.
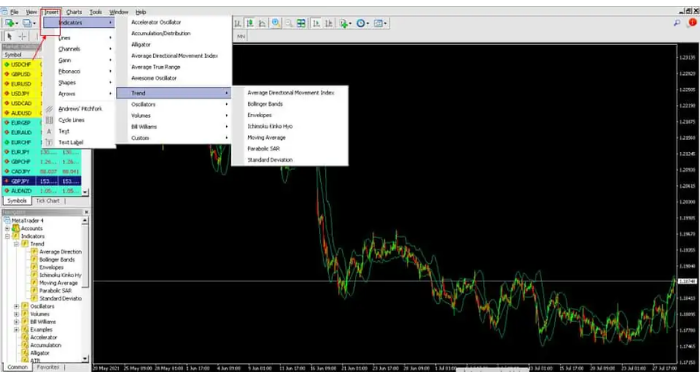
- When the Bollinger Bands settings window appears, follow the same steps as Method 1.
3. TRADING METHODS USING BOLLINGER BANDS IN FOREX
To use Bollinger Bands effectively in forex trading, you can refer to tricks used by many traders. The most common are:
- Utilize market trends: Traders can identify entry signals by using the Bollinger Bands as support and resistance levels.
- Bollinger Squeeze: Apply volatility indicators of the bands.
- Bollinger Bounce – Rebound from the bands.
- Combine with other indicators.
3.1. Trading Bollinger Bands According to Trend
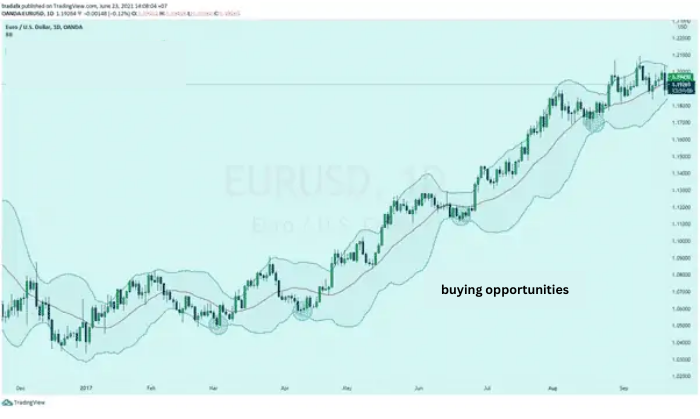
The chart above illustrates the EUR/USD pair on a daily time frame.
The chart shows that the EUR/USD pair is in an uptrend, which is indicated by higher highs and higher lows. Using the Bollinger Band indicator, the lower band is considered as a support level. When the price touches the lower band, traders view it as a signal to enter a buy trade. This strategy works for both uptrends and downtrends. The take-profit level is typically set at the upper or lower bands, depending on the trend. In this example, the upper band is used as the take-profit level.
3.2. Bollinger Band Squeeze Strategy
The Bollinger Squeeze, also known as the “bottleneck” trading strategy, occurs when the price is not always in a sideways trend, and the two Bollinger Bands do not always fully capture the price action.
According to John Bollinger, periods of low volatility often follow periods of strong price movements.
However, for new traders, identifying market volatility is not always an easy task.
Below is a weekly chart illustration of the EUR/USD pair:
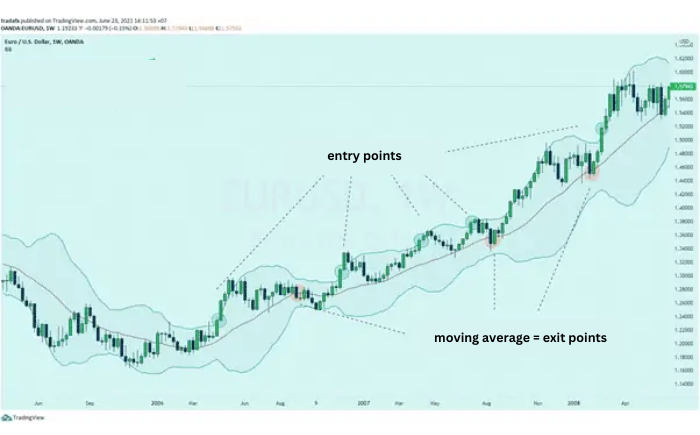
As mentioned earlier, when the bands contract, volatility is low, and vice versa. The Bollinger Squeeze seeks breakout points above/below the bands, depending on the trend, which serves as the entry signal.
The points marked in green indicate breakout points in an uptrend. Traders will look for entry points at the designated green circles. After each entry, you can observe that the candles are “moving with the Bollinger Bands” (following the upper band). After the candles break out of the bands, the bands widen, showing increased volatility in the market.
The circles illustrate the points at which traders will take profits before looking for the next breakout signals.
When applying the Bollinger Bands indicator, many articles and blogs also mention the Bollinger Band Width. The Bollinger Band Width measures the percentage difference between the upper and lower Bollinger Bands.
When the price breaks out of the Bollinger Band Width accumulation, it often leads to a strong move in one direction. If the price is moving sideways at the top, a breakout will tend to move down. Conversely, if it’s sideways at the bottom, a breakout is likely to move up.
However, the Bollinger Band Width is not an indicator available on MT4. You can download it below if you want to learn more about this indicator. However, based on Forex experience, applying Bollinger Bands with other indicators can produce similar results. Therefore, you don’t necessarily need to use the Bollinger Band Width in your trading strategy.
Download the Bollinger Band Width Indicator: Download
3.3. Bollinger Bounce – Rebound from the Bands
In fact, the upper and lower bands of the Bollinger Bands indicator can be seen as dynamic support and resistance levels.
Bollinger Bounce refers to the phenomenon where the price, upon touching the upper or lower bands, rebounds toward the middle band.
As mentioned earlier, Bollinger Bands provide a definition of high and low prices for traders, so we can formulate a trading idea of buying low and selling high.
This can be considered one of the simplest trading strategies. The way to use Bollinger Bands for this strategy is:
- Sell when the price touches the upper band.
- Buy when the price touches the lower band.
At this point, you may think this is very simple. However, the theory works well in a sideways market but comes with significant risk when the market is volatile. If you are a new trader, we do not recommend applying this strategy as you may not yet have the ability to filter out false signals from price action.
3.4. Combining with Other Indicators
Most traders are reluctant to apply Bollinger Bands analysis with other indicators. However, as mentioned in the limitations, the Bollinger Bands are just another technical indicator in forex, and using it alone can be risky.
Most traders combine Bollinger Bands with the RSI or other indicators to increase the accuracy of the signals. Combining Bollinger Bands in this way will improve the accuracy of the signals and reduce noise during trading.
This is also the method suggested by John Bollinger himself for using Bollinger Bands. Therefore, TradaFX will introduce additional detailed articles on combining Bollinger Bands with other indicators, so make sure to follow along!
4. BOLLINGER BANDS TRADING STRATEGY IN FOREX
4.1. Bollinger Band Scalping Strategy on EUR/GBP
The five-minute EUR/GBP chart below shows a scalping trading system with Bollinger Bands used during a period of relatively low volatility (narrow bands). The standard period of 20 with 2 standard deviations is set for this system.
Accumulation phases tend to repeat during this time, and adjustments can be made for the time of day when the strategy is most effective. In this system, the upper and lower bands serve as support/resistance levels.
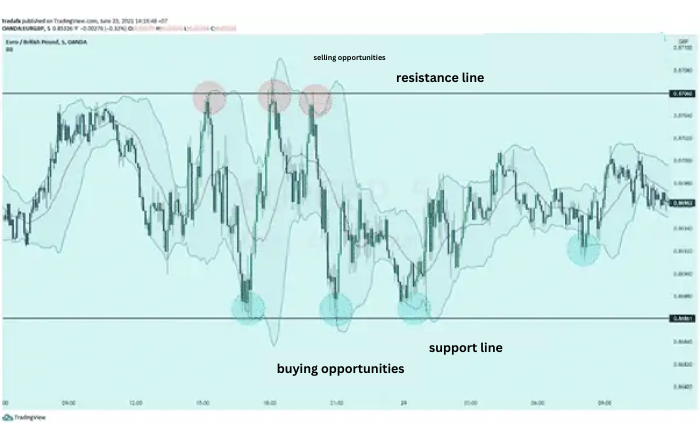
Support bands indicate buying opportunities. Resistance bands record sell signals marked on the chart. These areas can also be used as exit levels depending on the direction of the trade.
4.2. Advantages and Disadvantages of Day Trading with Bollinger Bands
| Advantages | Disadvantages |
| Easy-to-use strategy suitable for novice traders. | Day trading with Bollinger Bands only works in low-volatility markets. |
| Does not require any additional indicators. | The risk-to-reward ratio is relatively low. |
One limitation of Bollinger Bands is that they are primarily reactive, not predictive. The bands react to changes in price movement, whether an uptrend or downtrend, but they do not predict price levels. In other words, like most technical indicators, Bollinger Bands are lagging indicators. This is because the tool is based on a simple moving average, which takes the average price over a set number of price bars.
Although traders can use the bands to evaluate trends, they cannot use this tool to predict prices. John Bollinger, the creator of Bollinger Bands, recommends that traders use them in combination with two or three other tools to get a more comprehensive view of market signals.
Another limitation of Bollinger Bands is that the default settings may not work for all traders. Traders often adjust the settings to match the specific market type they are trading. If the chosen settings are ineffective, traders can change the settings or use an alternative tool.
The effectiveness of Bollinger Bands varies from market to market, and traders need to adjust the settings even when trading in the same timeframe. Therefore, investors need in-depth knowledge of Bollinger Bands to use this tool more effectively.
5. SUMMARY
This indicator has become increasingly popular due to its simplicity and the effectiveness it brings. However, this simplicity can also lead many traders to use it casually in their trading strategies without truly understanding the indicator.
The above provides a general overview of what Bollinger Bands are in Forex trading. It is one of the basic indicators in forex trading, and TradaFX will continue to add more in-depth knowledge in future articles. Be sure to follow our website!
- t.me/finance_solutes
- Website: https://finance-solutes.com
- Hotline: +1 929 5636 439 ( Hotline )
- 26 Broadway, Suite 934, New York, 10004, US
