
 XM
XM Bybit
Bybit Binance
 Robinhood
 Webull
 IC Markets
 Pepperstone
 OKX
OKX Vantage
 VT Markets
 BingX
BingX Gate.io
 Kucoin
 MEXC
MEXC Exness
 Bitget
As a financial investor, you should not ignore the ROA index. This is an extremely important and meaningful index when participating in financial investment. So what is the ROA index? How to effectively apply this index in practice? What should you avoid to limit potential risks that may occur? Let’s find out the detailed content of this article with Forex.
What is ROA?
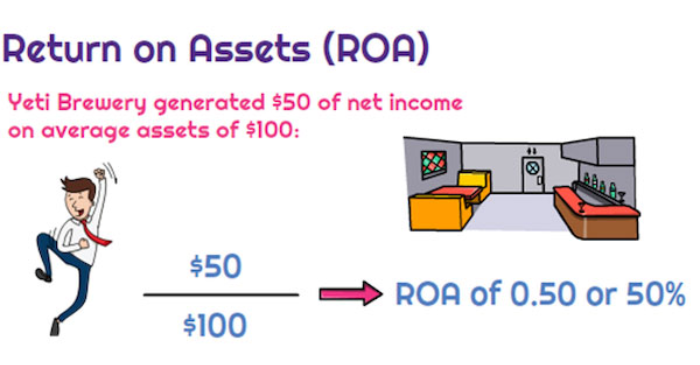
Let’s first explore the concept of ROA in detail. ROA stands for Return on Assets, which represents the profitability relative to a company’s total assets. ROA is a measure of how efficiently a business utilizes its assets or the ability to generate profit for every dollar of assets it owns.
ROA is considered a very important indicator to help investors choose good stocks to invest in. Through ROA, investors can more easily evaluate a company’s effectiveness in converting investment capital into profits. The higher the ROA, the more efficiently the company utilizes its investment capital.
The most accurate method to calculate ROA
To calculate the ROA effectively, you simply need to apply the following formula to obtain the most precise result:
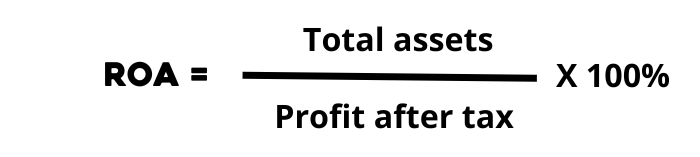
The indicators include:
- Profit after tax = total income – total expenses – corporate income tax. Profit after tax is derived from the income statement.
- Total assets refer to the total assets of any enterprise at the time the report is prepared. This includes cash and cash equivalents, financial investments, receivables, inventory, fixed assets, investment properties, ongoing construction projects, and other assets. Total assets are shown on the balance sheet.
- Currently, the unit of measurement for ROA is percentage.
An example to help investors calculate ROA more easily in practical situations:
A company, A, recorded a profit after tax in 2021 of 2 billion VND, and its total assets for 2021 were valued at 22 billion VND.
=> ROA = (Profit after tax / Total assets) x 100% = (2 billion / 22 billion) x 100% = 9.09%.
Significance of the ROA Indicator
Every financial indicator carries significant meaning. Regardless of the participant in the financial sector, ROA is crucial for business leaders, investors, and lenders. The specific significance of this indicator is as follows:
For Business Owners
- Using the ROA indicator, business managers can understand how much investment is required and how much net profit is generated. The higher the ROA, the more efficiently the business can utilize its assets.
- ROA also serves as a basis for businesses to make operational decisions. By comparing the ROA of companies of similar size over different periods or within the same industry, managers can gauge performance. If ROA is high, the business should continue its current strategy; if ROA is low, management needs to adjust its business strategy.
For Investors
- ROA is also used by investors to select stocks for investment. By comparing the ROA of companies in the same industry, a higher ROA indicates better profitability. However, this often also means higher stock prices. Additionally, investors should assess or compare a company’s ROA in the past to determine whether its current operations are performing well.
For Banks
ROA provides a comprehensive picture of a company’s financial performance. Banks use this ratio to evaluate the business conditions of a company and determine whether to approve a loan for that company.
What is a Good ROA?
There is no definitive benchmark for a “good” ROA. To accurately assess ROA, the following factors need to be considered:
Field of Business Activity
Each industry has distinct asset characteristics. For instance, companies in industries with significant fixed assets tend to have lower ROA. In contrast, businesses in the service and information technology sectors often have smaller fixed assets, leading to higher ROA. Therefore, to make accurate evaluations, it is essential to compare the ROA of companies within the same industry.
The table below illustrates the ROA of three different industries in 2020:
| Company Name | Industry | ROA (%) |
|---|---|---|
| Bỉm Sơn Cement Joint Stock Company | Building Materials | 3.50 |
| VIX Securities Joint Stock Company | Securities and Commodities Brokerage | 16.92 |
| Vietnam National Textile and Garment Group | Garment Manufacturing | 1.73 |
This table shows that the ROA of three companies in different industries varies significantly. Hence, comparing the ROA of companies from different industries makes it challenging to assess which company manages its assets better.
Average ROA in the Industry
Compare your company’s ROA with the industry average. If it is higher than the industry average, the company is managing its assets effectively, and vice versa.
| Company Name | ROA (%) |
|---|---|
| Bỉm Sơn Cement Joint Stock Company | 3.50 |
| Hà Tiên 1 Cement Joint Stock Company | 5.98 |
| Industry Average: Construction and Building Materials | 3.84 |
From the table above, the average ROA for the building materials industry in 2020 was 3.84%.
Bỉm Sơn Cement JSC: ROA = 3.5% < 3.84% → indicates suboptimal asset management.
Hà Tiên 1 Cement JSC: ROA = 5.98% > 3.84% → indicates effective asset management.
Historical ROA
If the current period’s ROA is higher than the previous one, it demonstrates that the company is improving its asset management efficiency. Conversely, if the ROA remains high but declines compared to previous years, it indicates deteriorating asset management effectiveness.
For example, consider the ROA trend of Bỉm Sơn Cement JSC in the non-metallic mineral product manufacturing and cement/concrete products industry from 2017 to 2020:
| Indicator | 2017 | 2018 | 2019 | 2020 |
|---|---|---|---|---|
| ROA | 0.07% | 1.99% | 2.87% | 3.50% |
The table shows a consistent increase in the ROA of Bỉm Sơn Cement JSC from 2017 to 2020. In 2020, it rose by 0.51% compared to 2019. This steady growth indicates improving financial and asset management efficiency. However, assessing whether the ROA is genuinely effective requires considering multiple aspects for accurate conclusions.
Relationship Between ROE and ROA
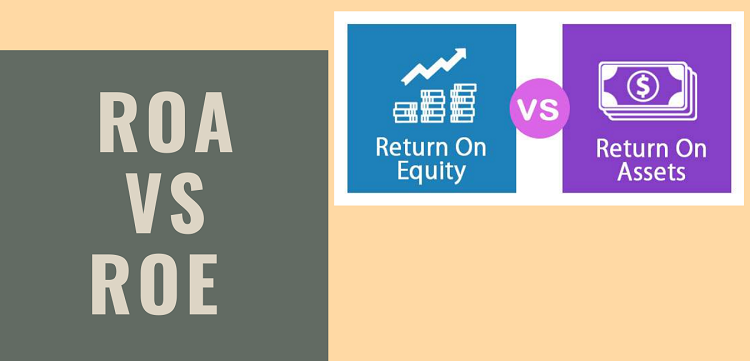
If you wish to gain deeper insights into the financial market, it is essential to understand both ROE (Return on Equity) and ROA (Return on Assets). These two indicators are crucial for evaluating a company’s operational efficiency. ROA and ROE are closely related, and their relationship is as follows:
Financial Leverage = ROE / ROA = Total Assets / Equity
This financial leverage formula serves as a highly convenient tool for business leaders to more accurately evaluate their ability to utilize capital in business operations.
This formula also clearly reflects the relationship between debt-funded capital and equity.
High leverage ratio: Indicates that the business is relying heavily on external borrowing to maintain operations rather than actively utilizing equity for production and business activities.
Low leverage ratio: Suggests that the company is primarily using equity to sustain operations and is actively engaging in production and business activities.
Notes When Using ROA
Although ROA is an essential indicator, it is important to consider the following points when using this metric to avoid counterproductive outcomes:
- Before evaluating whether a company’s ROA is good or not, you should pay attention to its industry of operation.
- It is essential to analyze ROA in conjunction with ROE (Return on Equity), ROS (Return on Sales), and Financial Leverage to gain a more comprehensive and accurate understanding of the company’s financial position, the ROA of industry competitors, and the historical ROA of the company.
Illustration of ROA
Below are some specific examples to help you better understand how to use and apply the ROA indicator effectively.
ROA of Vinamilk (Stock Code: VNM)
An illustration of Vinamilk’s stock performance is provided in the detailed table below:
| Financial Indicators | 2013 | 2014 | 2015 | 2016 |
|---|---|---|---|---|
| EPS (Thousand VND) | 7.84 | 6.07 | 5.84 | 5.83 |
| BV (Thousand VND) | 21.04 | 19.67 | 17.43 | 15.44 |
| P/E | 17.22 | 15.73 | 21.92 | 21.54 |
| ROA (%) | 28.56 | 23.55 | 28.29 | 31.83 |
| ROE (%) | 37.24 | 30.84 | 37.15 | 41.73 |
From the data, we observe that Vinamilk’s ROA consistently remained above 25%, with values of 28.56%, 23.55%, 28.29%, and 31.83% from 2013 to 2016, respectively.
This indicates that Vinamilk effectively utilizes its shareholders’ assets, making it a key driver behind the continuous rise in VNM’s stock price. VNM is a stock worth holding for the long term.
Additionally, other stocks like DSN, TCT, TTT, WCS, SKG, HPG, and FPT also demonstrate strong ROA performance. The remaining question is whether to purchase them at a reasonable price, isn’t it?
ROA of FLC Group
Below is an example illustrating the stock performance of FLC Group:
| Financial Indicators | 2013 | 2014 | 2015 | 2016 |
|---|---|---|---|---|
| EPS (Thousand VND) | 1.28 | 1.95 | 1.95 | 1.80 |
| BV (Thousand VND) | 16.30 | 12.43 | 11.76 | 13.17 |
| P/E | 6.88 | 5.59 | 4.05 | 2.89 |
| ROA (%) | 4.72 | 6.59 | 9.19 | 5.70 |
| ROE (%) | 7.88 | 9.09 | 14.48 | 12.16 |
FLC’s ROA consistently remained below 7.5%, reflecting a lackluster business performance. Moreover, stocks such as FLC, KLF, HAI, ROS, and ART are typically considered speculative or short-term trading stocks.
The above information provides a comprehensive overview of ROA. Mastering these metrics will undoubtedly enable you to navigate the financial market and generate profits effectively. Best of luck!
- t.me/finance_solutes
- Website: https://finance-solutes.com
- Hotline: +1 929 5636 439 ( Hotline )
- 26 Broadway, Suite 934, New York, 10004, US
