
 XM
XM Bybit
Bybit Binance
 Robinhood
 Webull
 IC Markets
 Pepperstone
 OKX
OKX Vantage
 VT Markets
 BingX
BingX Gate.io
 Kucoin
 MEXC
MEXC Exness
 Bitget
What is ATH? This is a question that attracts the attention of many traders. ATH, or “All-Time High,” is a term used to describe a period when the price reaches its highest value ever. While ATH can sometimes be a positive sign, it can also pose significant risks for traders. To avoid potential pitfalls, it is essential to understand its specific characteristics in detail. So, what should traders do when faced with an ATH position to maximize their trading effectiveness? Let’s explore the key rules to apply in ATH situations with Forex.
Key Information About All-Time High (ATH)
Before diving into how this term works, let’s start by exploring some general information you should know about ATH.
What is All-Time High (ATH)?
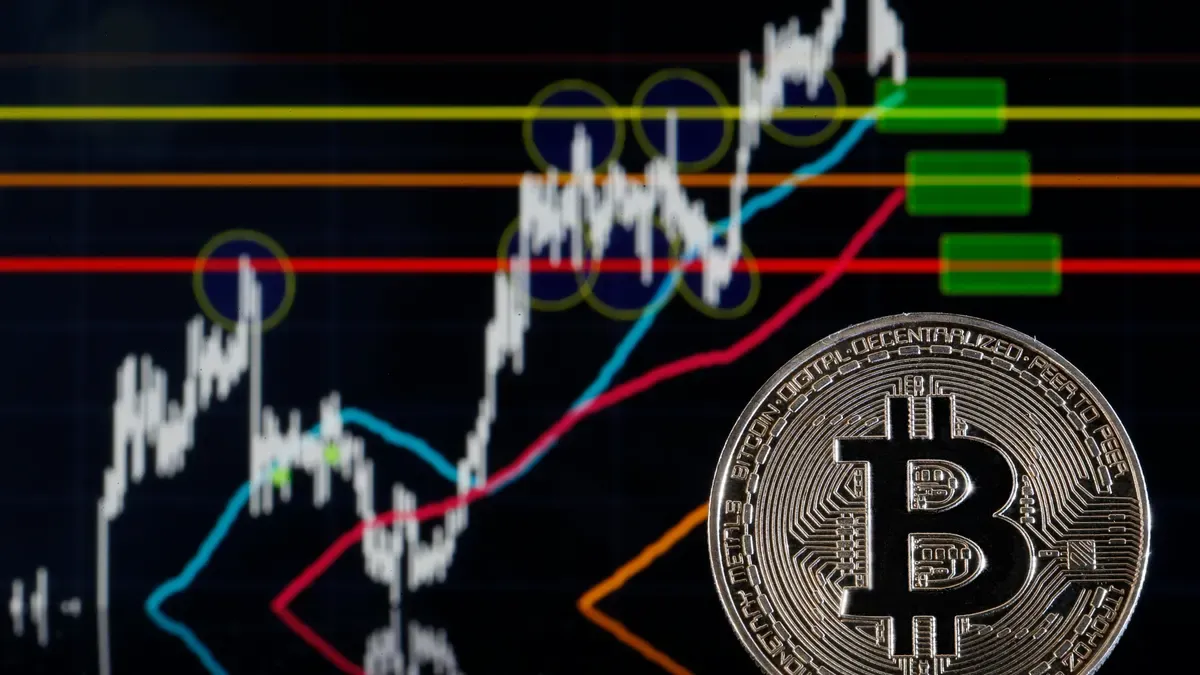
All-Time High, abbreviated as ATH, refers to the highest price level ever reached over a given period. This metric represents the moment when the market hits its peak. When this price level appears on the price chart, traders should seize the opportunity and apply the right strategies to achieve the best trading outcomes.
Is the Appearance of All-Time High (ATH) Significant?
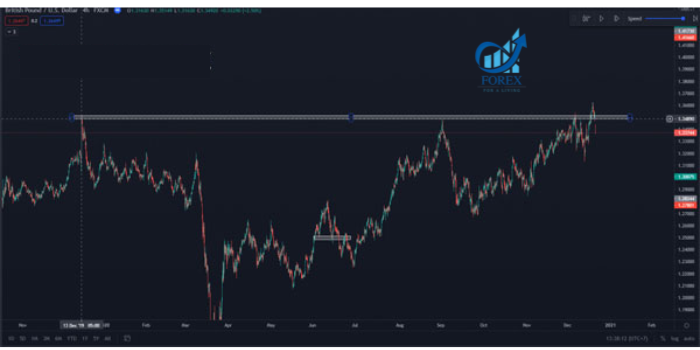
When ATH occurs, traders must recognize that the rally has reached a critical milestone—a new range that has never been seen before. At this point, the crowd is generally not inclined to sell. This often happens when there is a supply-demand imbalance in the market, with demand significantly outpacing supply. As sellers are too weak compared to strong buyers, this imbalance creates favorable conditions in the market. As a result, high profits can be achieved.

When ATH occurs, it suggests that prices could quickly surpass expectations. However, in such situations, a typical forex trader might make decisions and take actions based on emotions rather than a structured strategy.
Rules Traders Need to Follow When Trading with All-Time High
The resistance at ATH may eventually dissipate, but there will still be some resistance present. Sometimes, this can surprise traders even with technical analysis. To reach an ATH, the available supply at the given moment in the market has been fully absorbed during the price rally. After this, it may take several weeks or even months for the price to reverse in this period. Additional control is necessary when the price test takes place. Inexperienced traders are likely to face difficulties and losses in these situations. However, the following rules can help traders avoid these pitfalls.
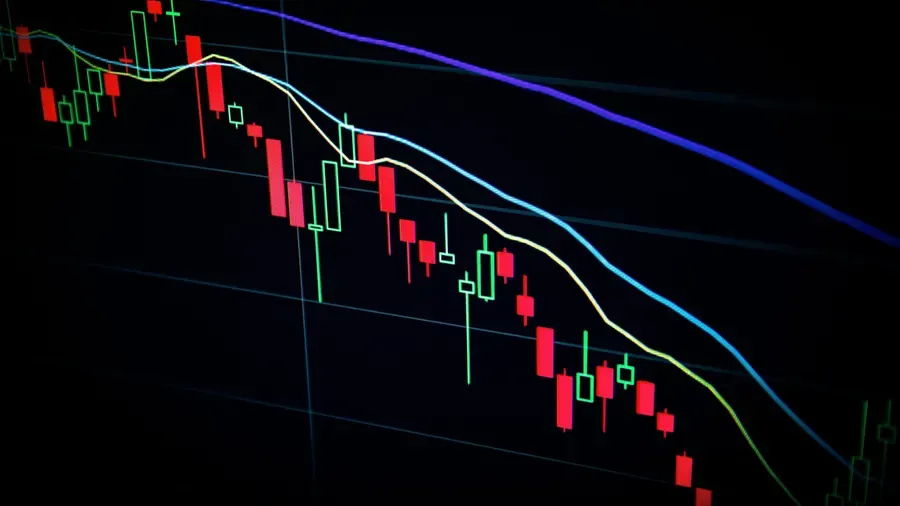
Rule 1: Analyze the Price Breakout Process
To push the price to a new high, this process typically occurs in three specific and clear stages. The first stage is pushing the price above a resistance level. This attracts a massive influx of trading volume. As a result, the recent high may be higher than the average. At this point, the “Action” phase is marked.
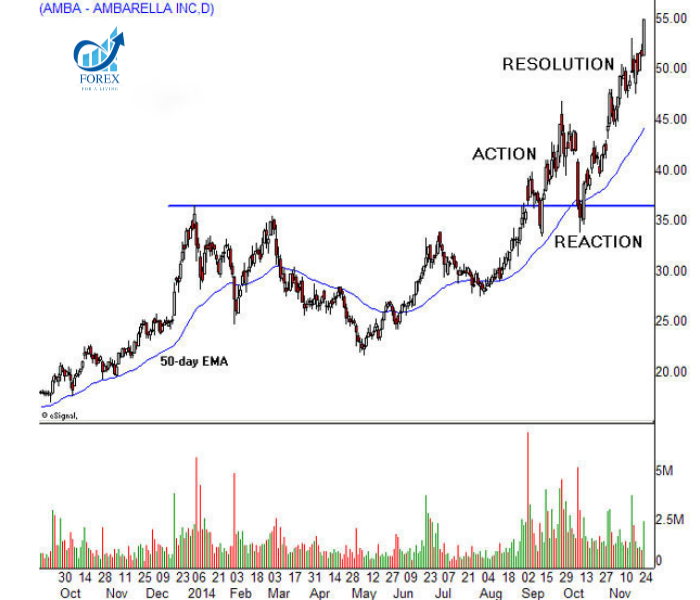
The second stage transitions into the growth momentum phase. At the same time, there will be a pullback in price due to weakening buying power. From this stage, the “reaction phase” begins, and traders also start to test the durability of the pause period. To confirm the trend breakout, it is important to assess whether the price will hold or if it has the potential to rise higher than the previous level. If the opposite occurs, of course, the price will drop, and the bullish rally will come to an end.

Based on the results of the previous two stages, a third stage is formed, as shown in the example below, called the “Accounting Stage.” In this “trading stage,” traders should pay attention to examining the OBV (On-Balance Volume). Additionally, consider the support level from the lower resistance line to the uptrend, whether it is high or low. When an index or stock value reaches an ATH, it becomes a significant issue. This creates a surge of interest and attracts strong buying activity in the market. However, if this does not occur, the breakout trend should halt.
Rule 2: Consider the Price Pattern Structure
To reconsider the price pattern structure, traders can make judgments right below the breakout point, but not too deeply. The base candle pattern is where trends can be marked. Therefore, to determine whether a breakout is occurring, traders need to monitor, look for a candlestick, and analyze whether square or circular bottom patterns are forming at the base of this candlestick.
Rule 3: Identify the Location of Potential New Resistance Levels
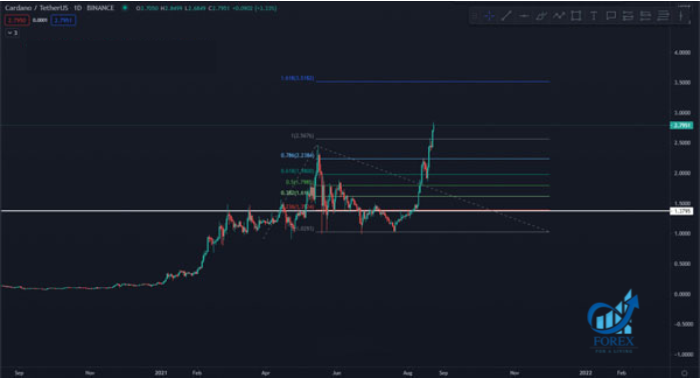
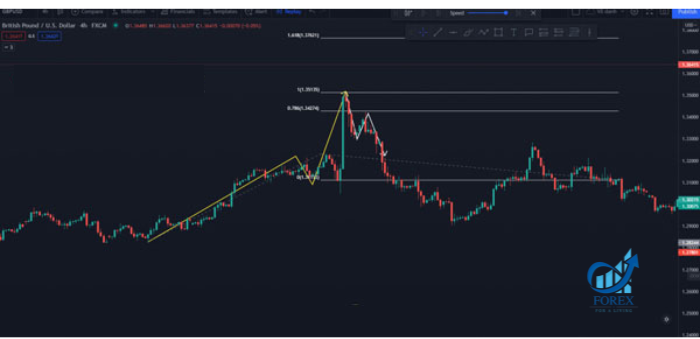
A specific example is at points like 2618, 2000, 1618, and 1270. We will use the Fibonacci indicator to mark the extensions at these points from the low to the breakout level of the trading range. When the price breakout moves upwards, these are the potential resistance levels that traders can identify.
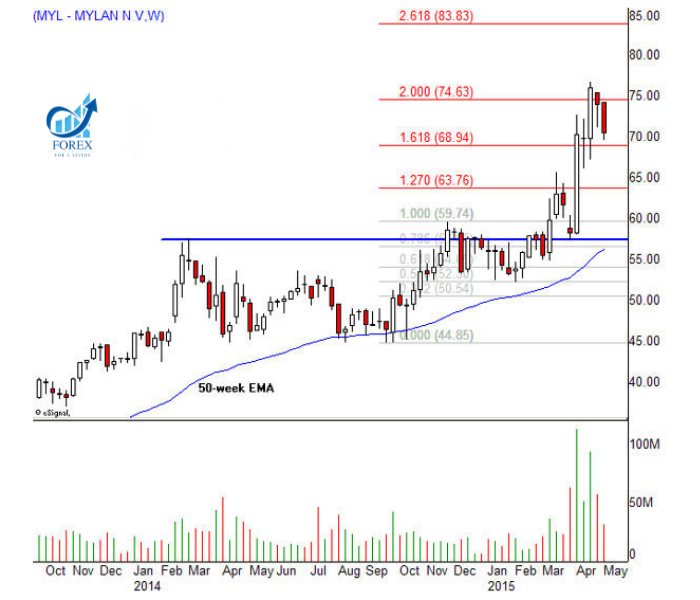
At 2618 (the high), it will mark a strong resistance level. It may indicate a new break. Therefore, when this price level is reached, traders should consider re-targeting their profit targets.
Rule 4: Set a Price Level to Protect Profits
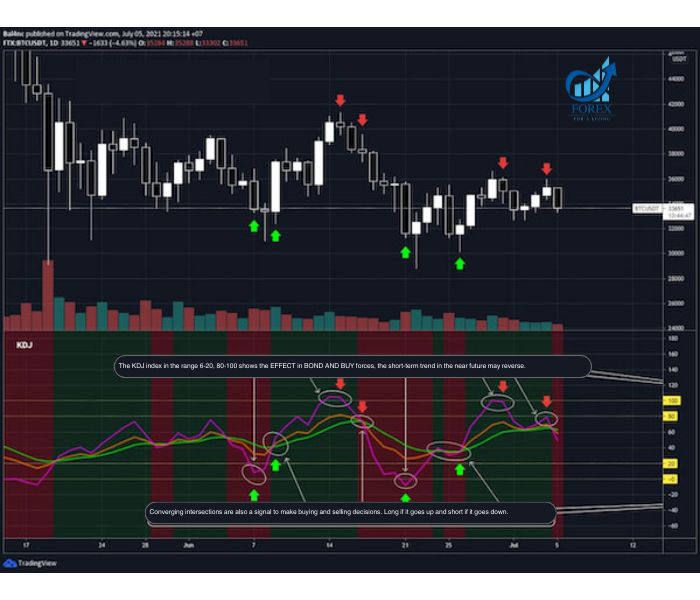
Assuming that the price breakout has been confirmed by signals, at this point, traders need to protect their profits by setting specific rules to apply them effectively. First, consider the minimum profit you expect. How much do you want to receive? If the uptrend then turns into a downtrend, the trader should lock in profits.

Traders can cycle through percentage levels (10%, 20%, 50%) or absolute values ($5,000, $10,000, $25,000) to select a suitable number. To avoid wasting potential profits, traders should wisely seize and capitalize on opportunities to generate profits that match the efforts analyzed above.
Rule 5: Consider Carefully When Increasing Position Size
It can be seen that traders can increase their profits by buying more when they see prices rise during a trade. However, traders can also achieve the opposite effect, for example, by not choosing the right buying moment. At this point, the total profit you can make with this principle is similar to when the price touches the support level of the MA line. Traders should only increase their position when the price is within a region that offers a favorable risk-to-reward ratio (RR).
Markets Where All Time Highs Often Appear
There are many instances where All Time Highs (ATH) appear suddenly, catching many off guard. Because of this, traders often wonder about the specific markets where ATH occurs. Let’s explore this topic below.
Some Prominent Markets Where ATH Often Appears
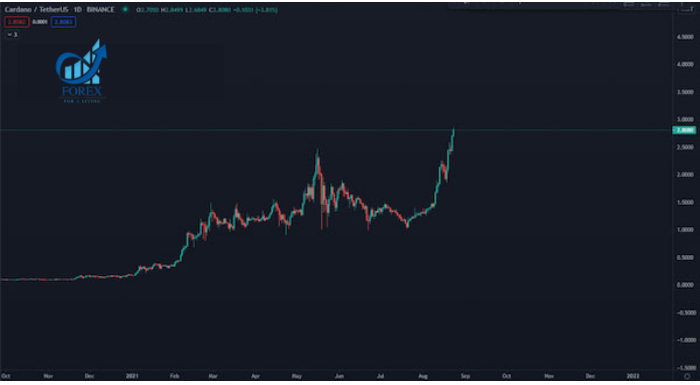
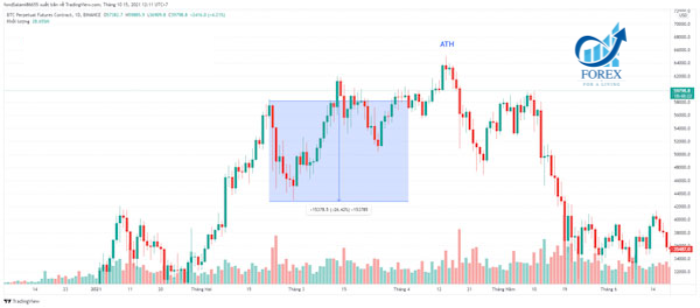
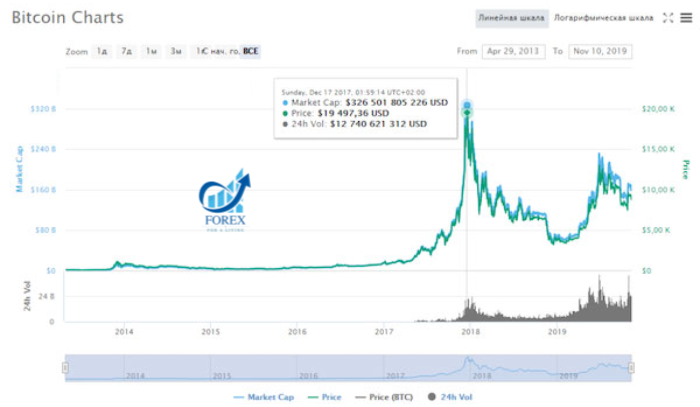
All Time Highs are often achieved in emerging markets. ATH can also occur in markets with smaller market capitalizations, such as currencies. Studies show that many cryptocurrencies have reached their ATH during bullish trends, such as ADA, ETH, BTC, and more.
- t.me/finance_solutes
- Website: https://finance-solutes.com
- Hotline: +1 929 5636 439 ( Hotline )
- 26 Broadway, Suite 934, New York, 10004, US
