
 XM
XM Bybit
Bybit Binance
 Robinhood
 Webull
 IC Markets
 Pepperstone
 OKX
OKX Vantage
 VT Markets
 BingX
BingX Gate.io
 Kucoin
 MEXC
MEXC Exness
 Bitget
Volatility is one of the most common terms in the stock market, but most new investors often know very little about this term. To better understand what Volatility is? What are the characteristics and nature of Volatility? Let’s find out information about Volatility with Forex right below.
What is market volatility?
Volatility is the fluctuation of the market, a measure that helps quantify the dispersion of returns with specific indices in the stock market. In most cases, the higher the volatility, the higher the potential risk associated with that security. This volatility is typically measured in terms of standard deviation/variance of returns for the same type of index in a particular stock market.

For the stock market, market volatility is typically associated with large fluctuations in two directions. For example, when a stock moves up or down by more than 1% within a certain period, this is considered volatility. The volatility of an asset is regarded as a key factor in determining the value of options contracts.
What are the points to note when looking for Volatility information?
- Volatility is expressed as the extent to which an asset fluctuates around its average price. It is a measure used to quantify the variation of returns for different commodities.
- To measure volatility, we can use pricing models, standard deviation, and the Beta coefficient.
- Assets that are prone to high volatility are considered riskier compared to those with low volatility.
- Volatility is an important parameter in determining the strike price of options contracts.
Learn more about what Volatility is?
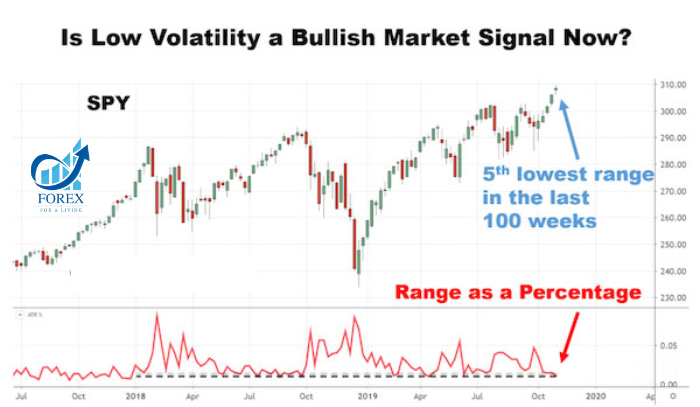
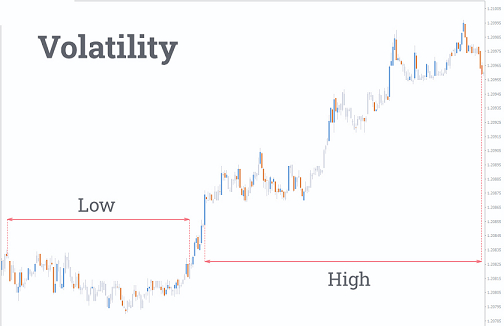
To understand volatility more deeply, it typically refers to the level of risk or uncertainty associated with the magnitude of price changes in a security. When there is high volatility, the price of that security can fluctuate significantly within a large range. This means the price can change dramatically in a short period in either direction. On the other hand, low volatility indicates that the security’s price won’t experience sudden changes and will remain relatively stable.
One way to determine the volatility of an asset is by quantifying its daily returns. Historical changes based on past prices represent the variations within the return range of the asset and are expressed as a percentage.

Variance represents the dispersion of returns around the average value of an asset. Volatility is considered a measure of this variance and is limited to a specific time period. Therefore, we assess changes on a daily, weekly, or other periodic basis, and this is referred to as the standard deviation.
Causes of Price Fluctuations
The price of a financial asset fluctuates due to changes in its supply and demand. The main cause of this change comes from information sources. This is why we often see products that are frequently updated with news experiencing more volatility.\

There are four factors that cause price fluctuations as follows:
- Liquidity: A product chosen by many investors will naturally experience higher volatility.
- External Factors (Natural Disasters/Pandemics): Although these events don’t occur frequently, they can have significant effects on financial products, even causing sharp price declines. These factors impact the country’s economy.
- Supply and Demand: Demand is the most important factor causing significant price fluctuations.
- Leverage in Trading: Assets using leverage typically experience strong volatility because traders generally engage in short-term transactions. Additionally, high margin fees can also lead to greater price fluctuations to compensate for interest costs.
How to Calculate Volatility
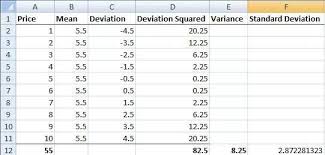
We will use variance and standard deviation to calculate volatility. To calculate standard deviation, we take the square root of the variance.
If the closing prices for each month range from $1 to $10, with January at $1, February at $2, and so on, we follow these steps to calculate the variance:
Step 1: Calculate the mean of the data.
We sum all the values and then divide by the total number of values:
(1+2+3+4+5+6+7+8+9+10)/10=5.5 USD
The mean value is $5.5.
Step 2: Determine the deviation between the values and the average value is called the deviation. Take 10-5.5, 9-5.5 …. 1-5.5 respectively. This difference is likely to be negative. To calculate these values, consultants can use Excel and google sheets to support.
Step 3: We will use the standard deviation in step 2 and average them to eliminate the negative values.
Step 4: Add the values in step 3 together, in this example it will be 82.5.
Step 5: Divide the value in step 4 by 10.
The result we calculate will be 8.25 USD and the square root of it will be 2.87. This number is considered a measure of risk value and shows how those values compare to the average. Through this, investors can have an idea of the price difference compared to the average price.
If the price is randomly taken from a normal distribution, 68% of the values will lie within one standard deviation (2 * 2.87), and 99.7% of the values will lie within three standard deviations (3 * 2.87). In this case, the prices from $1 to $10 will not follow a random distribution along the bell curve but will instead be distributed evenly.
Other Measures of Volatility
A common measure of relative volatility for a specific stock in the market is Beta. Beta estimates the overall volatility of a security’s returns compared to the returns of a related benchmark.
For example, if a stock with a beta of 1.1 has moved 110%, each move would be 100% of the benchmark based on price. If the stock has a beta of 0.9, which has moved 90% historically, each move would be 100% based on the underlying index.
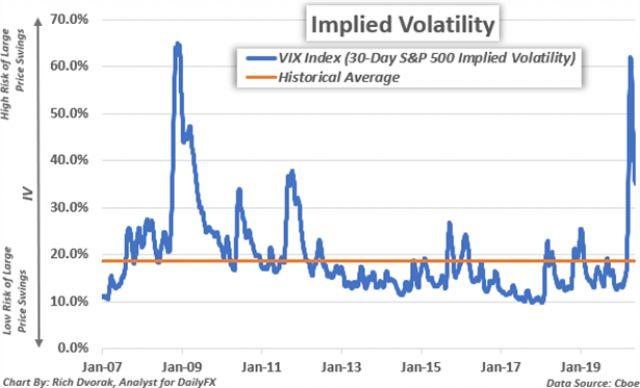
Volatility in the market is also considered through the VIX or Volatility Index. The VIX, formed by the Chicago Board Options Exchange (CBOE), is a measure of the expected 30-day volatility in the US stock market. It reflects the implied volatility derived from options on the S&P 500, with real-time quotes reflecting the buying and selling decisions in the market. It helps assess future market uncertainty, particularly for individual stocks. If the VIX is high, it signals that the market contains significant risk.
Volatility is also embedded in option pricing formulas, where the profit generated from an asset fluctuates from the present time until the option expires. This volatility is represented as a percentage in the option pricing formulas and is derived from market transactions. The way volatility is calculated can influence the value of the option’s strike price.
In the context of option pricing models, Black-Scholes and the binomial tree model are commonly used to account for volatility. More volatile underlying assets tend to have higher premiums because they exhibit greater risk. As a result, these options are more likely to expire in the money (ITM). Options traders try to predict the future volatility of an asset because the current market price reflects the anticipated volatility.
Example of Volatility in Real Life
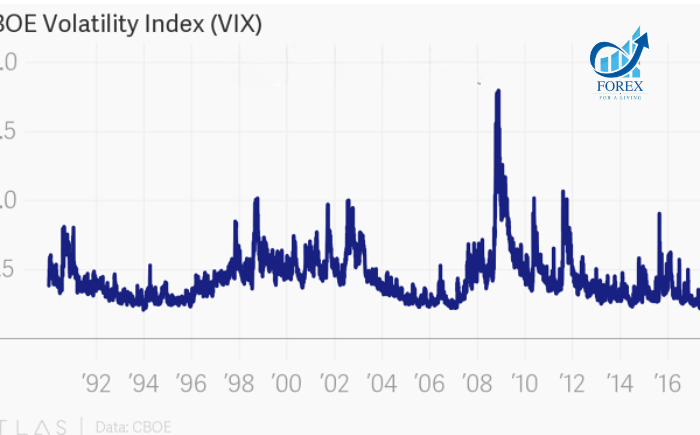
Consider a stock with a high historical volatility. If the stock fluctuates significantly in value over short periods, the implied volatility would also be high. Traders and investors would expect higher risk, which in turn raises the option premium and the likelihood of price changes, influencing how they buy or sell options on that stock.
For example, a trader is creating a retirement portfolio to invest because they anticipate retiring soon. They are looking for stocks with low volatility and stable profitability. Currently, two companies are being considered:
- MSFT Microsoft with a beta of 9.3, which has lower volatility compared to the S&P 500.
- SHOP Shopify with a beta of 1.61, which is more volatile compared to the S&P 500.
In this case, the trader may choose to invest in MSFT because it experiences less volatility and is easier to predict due to its short-term value.
This concludes the explanation of Volatility, which Forex has researched and shared with you. We hope that the information provided will help you make successful trades in the stock market.
- t.me/finance_solutes
- Website: https://finance-solutes.com
- Hotline: +1 929 5636 439 ( Hotline )
- 26 Broadway, Suite 934, New York, 10004, US
