
 XM
XM Bybit
Bybit Binance
 Robinhood
 Webull
 IC Markets
 Pepperstone
 OKX
OKX Vantage
 VT Markets
 BingX
BingX Gate.io
 Kucoin
 MEXC
MEXC Exness
 Bitget
Although the Ma Cross is a popular indicator in trading, most investors don’t fully understand what it is or its nature, which means they haven’t been using it effectively. To help investors better understand what the Ma Cross is, so they can analyze and execute trades more efficiently, avoiding risks in their trading, Forex has shared the key points about the Ma Cross as follows.
What is Ma Cross?
Concept of Ma Cross
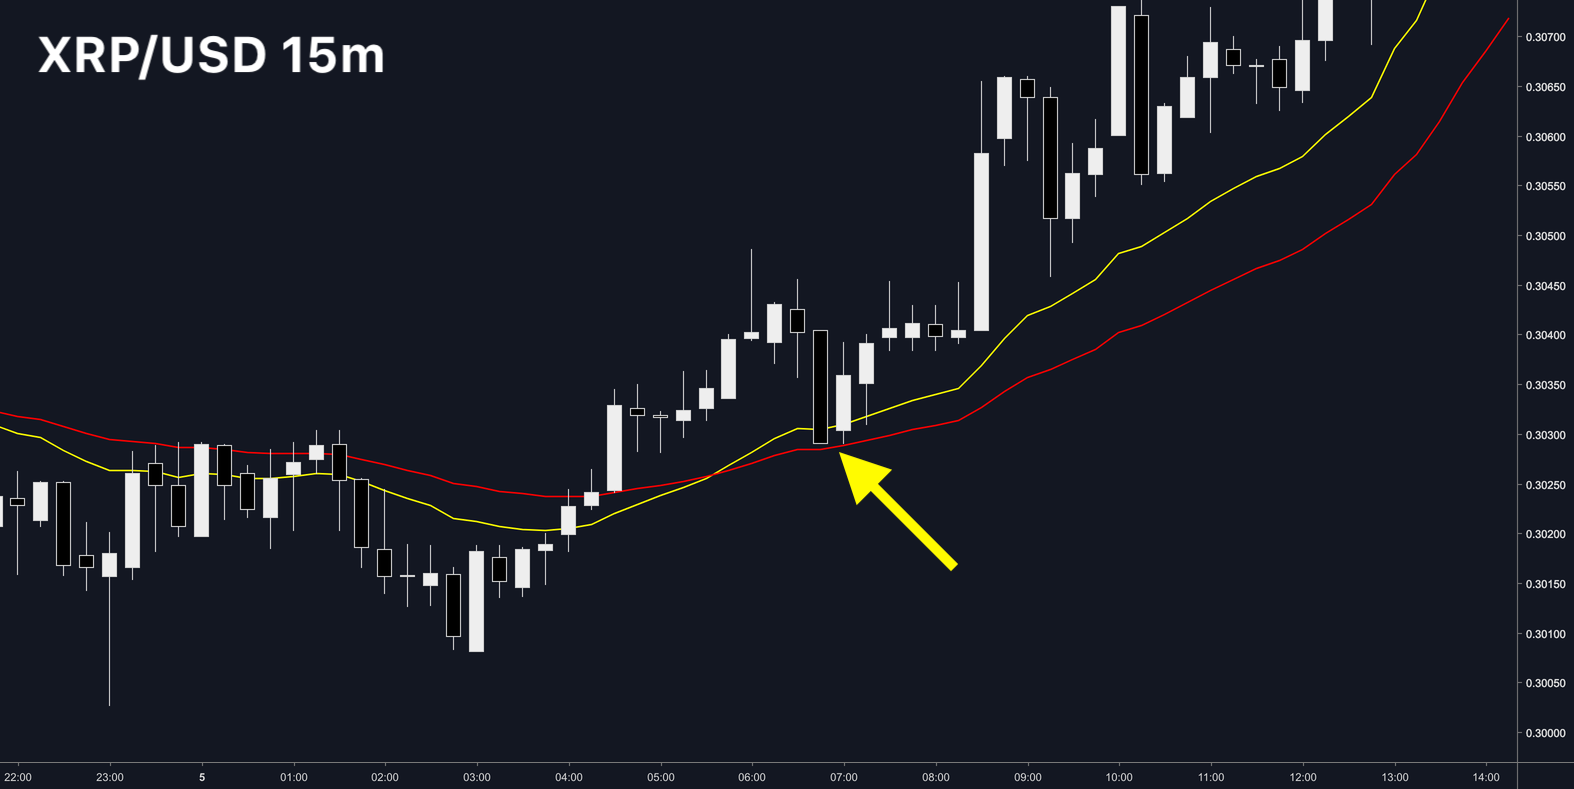
When moving average (MA) lines combine, they form the Ma Cross. Through the correlation between the different MAs, investors can get signals to make trading decisions.
With Ma Cross, investors can consider it as a trading method or system used for executing trades. It can also be seen as a tool used for analyzing various charts. Since the Ma Cross indicator is formed by multiple MA lines combining, it is considered a system that helps execute trades in the most complete way. However, traders can still combine Ma Cross with other indicators to increase potential profits.
Investors are free to use moving averages with different time periods. There is no limit to the number of MA lines investors can use. To form a Ma Cross, traders must use at least two MA lines.
Formation of Ma Cross and How to Use It
When investors apply two MA lines, they will need one with a shorter time period and another with a longer one. The shorter time period MA will be more volatile, and as a result, it will frequently cross the longer time period MA. These crossing points are considered valuable signals for traders.
If investors want to use more than two MA lines, they should arrange them in order from short to long time periods.
When using Ma Cross, traders should pay attention to the following principle: When the shorter-period MA crosses above the longer-period MA, the signal suggests an upward trend. Conversely, when the shorter-period MA crosses below the longer-period MA, the signal indicates a downward trend.
Regardless of how many MA lines are used, this principle remains applicable. Therefore, traders should focus on the crossing points between the MA lines.
Example: MA9 and MA20
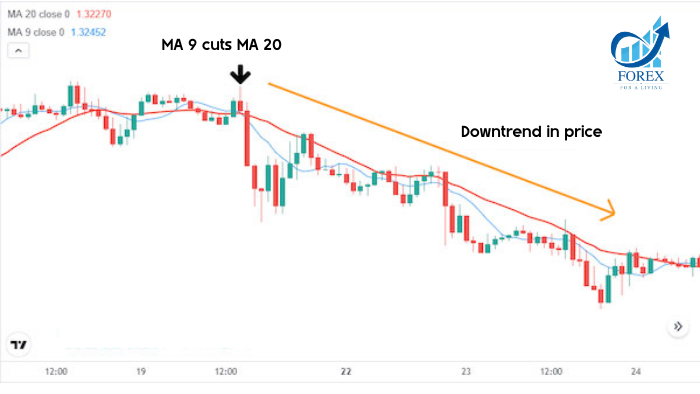
MA9 fast and MA20 slow crossing downward is a signal of a downtrend.
Regarding the MA lines, investors can use any type they prefer, including SMA, EMA, and VWMA.
The combination of SMA, EMA, and VWMA in MA Cross is not limited. Traders can combine 1 SMA with 1 EMA, 1 EMA with 1 VWMA, all three types of MAs, and other combinations.
Trading with Ma Cross
Once you understand what Ma Cross is, setting up a trading strategy with Ma Cross is not difficult. Traders can refer to some simple yet effective strategies for complex trades as follows:
Ma Cross Trading Strategy with Two MA Lines
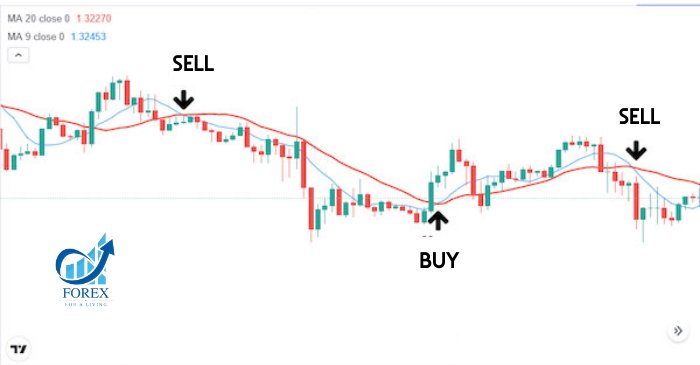
For two MA lines, traders can form a relatively simple trading strategy with Ma Cross. You just need to use one MA with a smaller, faster period combined with one MA with a larger, slower period.
When the moving averages form a crossover, the signals will be generated:
- When the smaller, faster MA crosses above the larger, slower MA, a buy signal will be formed.
- When the smaller, faster MA crosses below the larger, slower MA, a sell signal will be formed.
To better understand this combination, you can refer to the following example:
- When MA9 and MA20 cross downward, this is a sell signal.
- When MA9 and MA20 cross upward, this is a buy signal.
Trading Strategy with 3 MA Lines
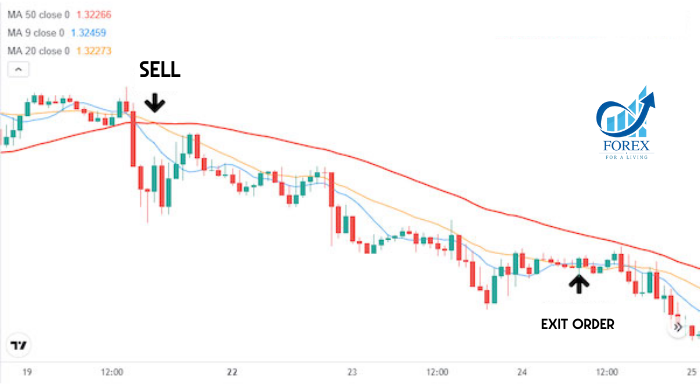
Three MA lines are the fast MA, slow MA, and average MA.
The signals will appear as follows:
For a buy signal:
- When the average MA crosses above the slow MA.
- The fast MA is positioned above the average MA.
For a sell signal:
- Traders will execute a sell order if the average MA crosses below the slow MA.
- The fast MA is positioned below the average MA.
In contrast to buy orders, traders can close sell orders if the fast MA crosses above the average MA.
Example of forming a MA Cross with 3 SMA lines: We have MA9 (fast), MA20 (average), and MA50 (slow). Traders will see a signal if the MA20 line (higher) crosses the MA50 line (lower), with the MA20 positioned below the MA50.
After executing a sell order, the price will likely decrease, and traders can close the sell order when the MA9 crosses above MA20.
Trading strategy with multiple MA lines:
If you want to use more than 3 MA lines, the strategy applied by traders becomes more complex, and they need to pay attention to a few additional points. The Multiple MA indicator, created by Daryl Guppy, consists of 6 short-term MAs and 6 long-term MAs, making a total of 12 distinct MAs.
The indicators include:
- Group 1: 6 short-term MAs 3, 5, 7, 10, 12, 15
- Group 2: 6 long-term MAs 30, 35, 40, 45, 50, 60
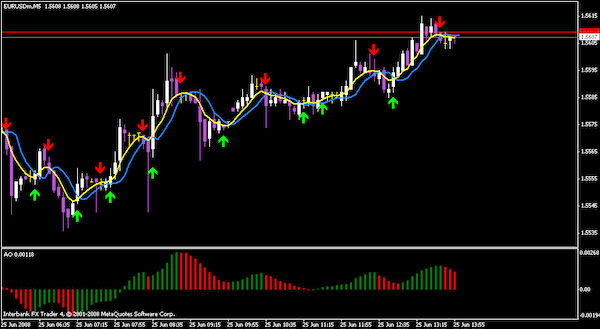
Group 1 and Group 2 represent two trading perspectives: short-term and long-term trading in the market.
With MA lines, traders can adjust the periods as desired with different time frames. However, if you’re a new investor with little experience, it’s recommended not to change these settings.
Trading signals when applying Multiple MAs:
Signals of convergence and divergence:
- When the MAs within the same group are close and parallel, most traders in that group share similar points of view.
- When the MAs start to diverge (widen), it indicates differing opinions within the same group.
- When MAs converge (crossing each other), it suggests a potential change in perspective.
Signals showing strong trend momentum:
- When the long-term MAs are parallel, it indicates that traders following the long-term trend support the current strong trend.
- If short-term MAs begin to separate over the long term, it further strengthens the trend’s momentum.
Signals showing weak trend momentum:
- If both groups (Group 1 and Group 2) show more fluctuations than usual and continuously cross each other, it suggests that the trend is weak.
When applying Multiple MAs, traders need to note that the crossovers are less important than the distance between the MAs within each group. MA Cross should be primarily used for trend identification and assessing the strength of the trend. Traders should combine trend analysis with other tools to receive better entry signals.
Setting stop-loss when using MA Cross strategy
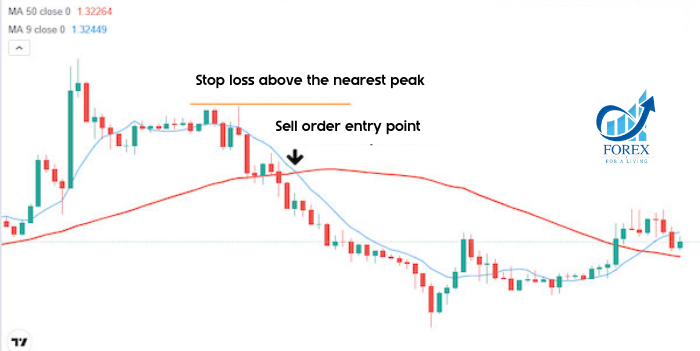
With each strategy, traders can choose different entry points and principles. However, when setting stop-losses in the MA Cross strategy, investors need to pay attention to the following:
For the MA Cross indicator, the stop-loss principle is quite simple. When you enter a trade at the crossover point of the MA lines, you can set the stop-loss at the high or low point just before the MA.
- If the MA9 crosses below MA50, traders can place a sell order at that point.
- Traders can set the stop-loss just above the peak near the entry point.
Take Profit when applying the MA Cross strategy:
When applying MA to execute trades, typically, traders will take profits manually and avoid setting automated take-profit orders because MA lines do not provide a specific take-profit level.
According to the principles, traders should close a position when the MA lines cross in the opposite direction, signaling that the price may reverse.
Example of closing a position with MA9 and MA50:
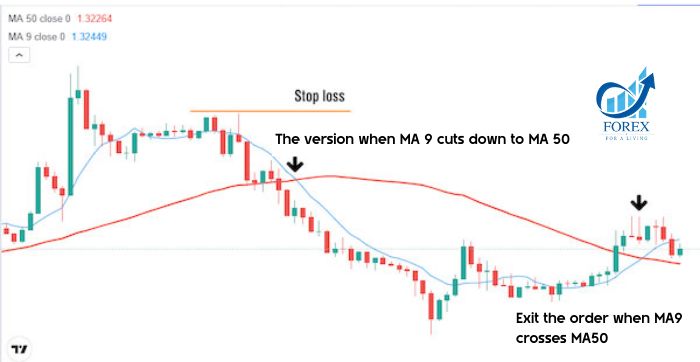
If investors want, they can use other methods to take profits, such as relying on the risk-reward (RR) ratio depending on different profit goals or based on support and resistance levels. You can use any method for taking profits, as long as it ensures that you can secure your profits effectively.
Advanced MA Cross Trading Strategy when combined with Price Action
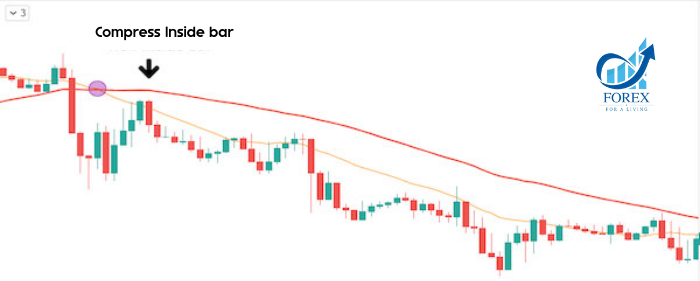
Traders can apply all the basic strategies provided by the MA lines. Additionally, you can combine the MA Cross indicator with other technical tools to form a more complete strategy.
You can combine MA with Price Action to make the signals more accurate.
The goal of this strategy is to find entry signals based on the crossover points of the MA lines combined with Price Action signals, such as chart patterns or candlestick formations. In addition, actions like taking profit and setting stop-loss can also be based on price action signals in combination with exit rules defined by the MA Cross, as mentioned earlier.
Example of Combining MA Cross and Price Action:
- We can see that the orange MA line is a fast indicator and the red MA line is a slow indicator. Now we can see that there will be a downtrend appearing.
- Where the two MA lines intersect, if the trader is not ready to execute orders, he or she can wait for signals from Price Action to be able to execute orders according to the current trend.
Through the example above, we can understand how the MA Cross and Price Action work together. This allows traders to implement their strategy effectively using candlestick signals and chart patterns, such as flags or double tops and bottoms. These patterns help traders identify optimal entry and exit points to maximize profits.
With the information shared by Forex, it’s clear that the MA Cross indicator is simple and easy to use. Therefore, any trader can build a strategy to apply the MA Cross indicator effectively.
- t.me/finance_solutes
- Website: https://finance-solutes.com
- Hotline: +1 929 5636 439 ( Hotline )
- 26 Broadway, Suite 934, New York, 10004, US
