
 XM
XM Bybit
Bybit Binance
 Robinhood
 Webull
 IC Markets
 Pepperstone
 OKX
OKX Vantage
 VT Markets
 BingX
BingX Gate.io
 Kucoin
 MEXC
MEXC Exness
 Bitget
“Trendline is your friend” – A highly popular saying in forex trading. The reason is that trends are crucial for any trading plan. Trendlines can be seen in most forex charts.
But what exactly is a trendline? Why is the trendline considered a trader’s best friend? And what are the four strategies traders can use to trade with trendlines? Let’s dive into today’s article!
1. WHAT IS A TRENDLINE?
What is a trendline? A trendline, also known as a trend line, is a straight line drawn on a chart that connects a series of price points. The trendline is also regarded as support or resistance levels in any timeframe.
A trendline shows the direction and speed of price movement. It can give traders a clearer picture of the market trend.
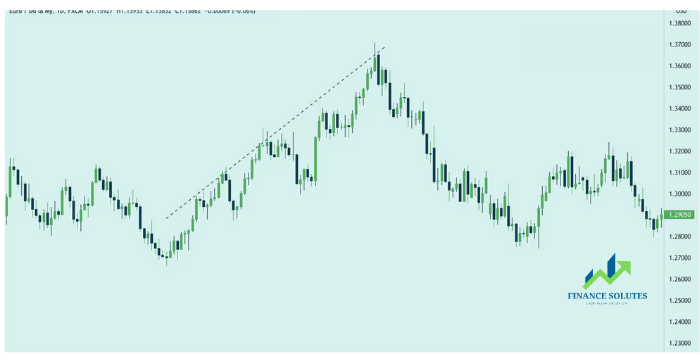
A trendline helps technical analysts identify the current direction of market prices. Technical analysts believe that “the trend is your friend,” and recognizing this trend is the first step toward making a good trade.
2. HOW TO IDENTIFY A TRENDLINE
To use a trendline effectively, traders must know how to identify and draw a trendline on the chart. To draw a trendline (whether upward or downward), you first need to determine the trend.
When drawing a trendline, it’s best to do it manually rather than relying on a trendline indicator to draw it for you. Some automatic trendline indicators can plot the trendline, but most of them aren’t very reliable.
2.1. Identifying the trend
To identify the trend, pull up the price chart of your chosen currency pair with about 100–200 candlesticks. Then, ask yourself: In which direction is the price generally moving?
If the trend is upward, confirm it by looking for a series of higher lows and higher highs on the chart. A valid uptrend will look like the chart below.
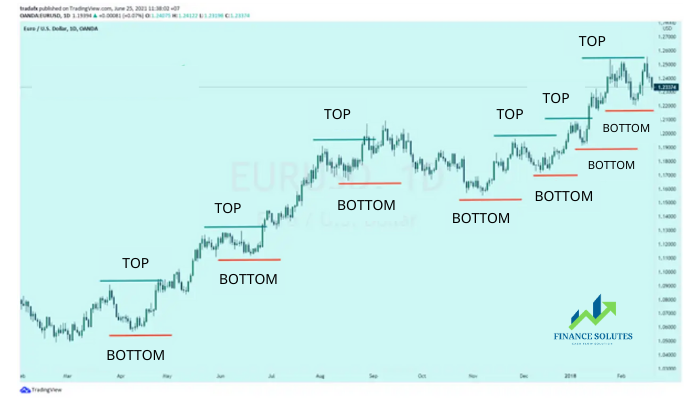
Note: The price will form higher highs and higher lows.
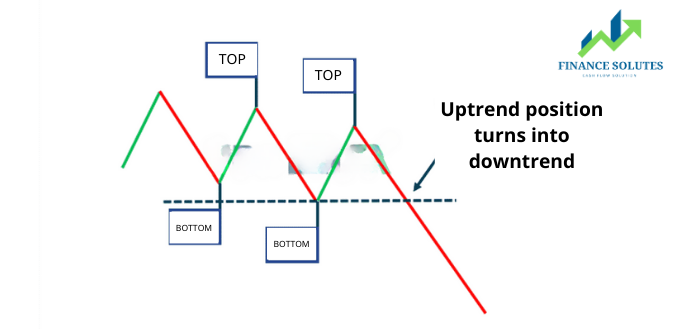
All trends eventually come to an end. For this reason, an uptrend will shift into a downtrend when a new series of lower highs and lower lows is established. Take a look at the image below. Traders should pay attention to moments when a trend reversal is likely to occur — this happens when the market breaks below the previous low.
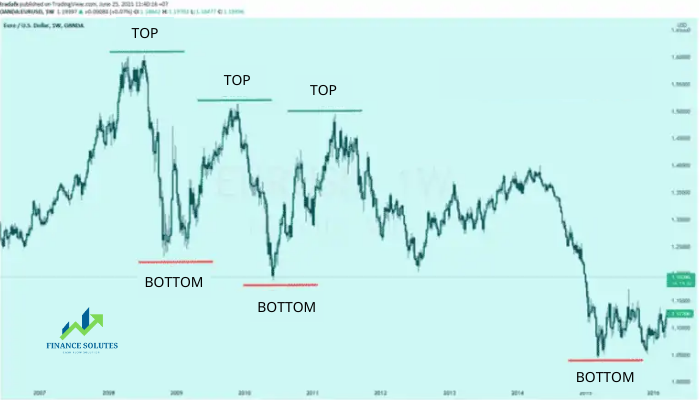
If the trend is downward, confirm it by looking for a series of lower highs and lower lows on the chart. Below is a chart of a valid downtrend.
This downtrend shifts into an uptrend when a new series of higher highs and higher lows begins to form. The image below illustrates the trend reversal.
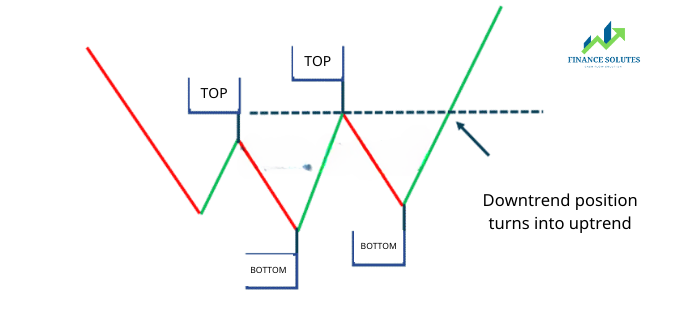
There are no strict rules for identifying highs and lows used in trend analysis. It’s best to choose what’s most evident regarding the uptrend or downtrend to trade.
You should look for a currency pair with a trend so clear that even a ten-year-old could identify it. If you’re unsure, search for another currency pair with a more obvious trend.
2.2. How to draw a trendline in MT4
First, open the chart of a currency pair. Below is the chart of the USD/JPY pair.
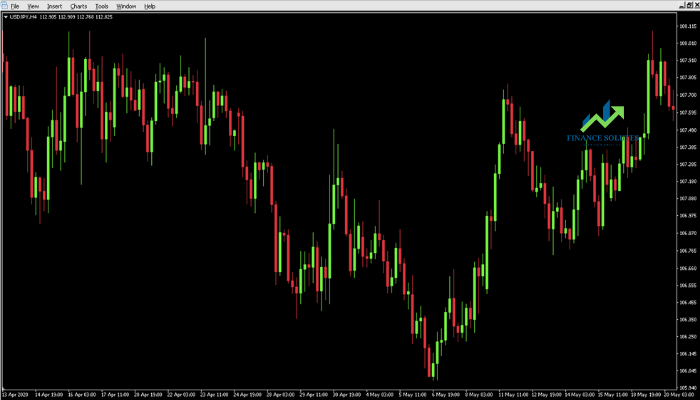
Can you spot the trend on the chart? It’s quite difficult to do so visually without the help of a trendline.
To confirm a trend, you need at least three points lying on the same straight line. When drawing a trendline, you must have a minimum of two points.
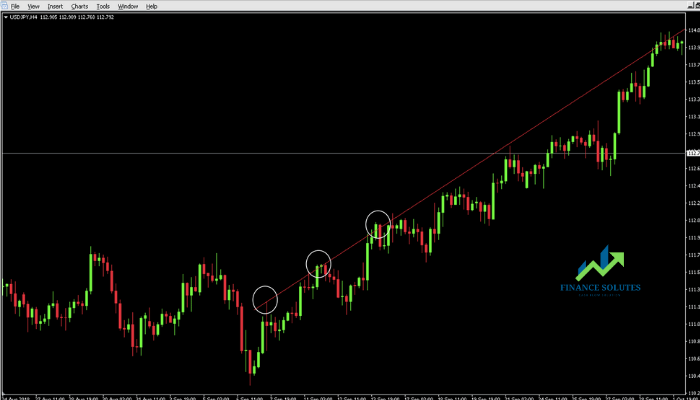
To build an upward trendline, you should focus on the candle bodies. Typically, the lower wicks may fall outside the trendline’s range. New traders often think trends follow a single straight line. In reality, it’s better to view the trend as lying within a zone or area.
Therefore, when price action breaks the trendline, it doesn’t necessarily mean the trend is broken.
3. TRENDLINE IS YOUR FRIEND
Top traders have acknowledged that no trading strategy has a perfect win rate. It may sound obvious, but this is precisely why traders need to be cautious and improve their chances of success. One crucial factor is the trend.
Learning to trade in an imperfect environment is essential. Trend trading is a simple way to support your strategy by identifying the strongest trends in the market.
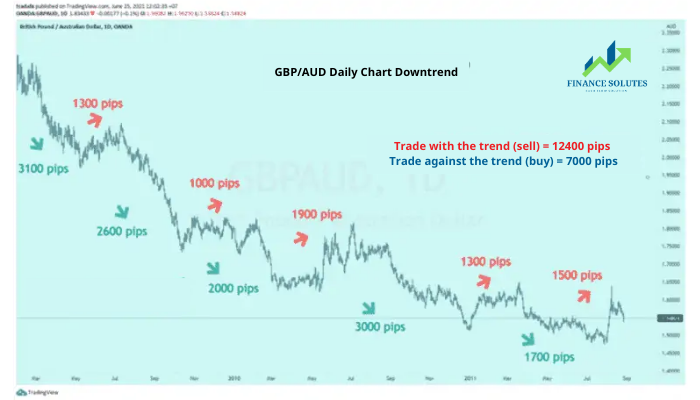
Take a look at the example below. You can see that a sell trade can still occur even when a trader enters during a temporary market upswing.
The dominant trend (a downtrend) is strong enough to turn a losing trade into a winning one, depending on where the stop-loss is placed.
Example: GBP/USD pair chart.
From the image above, you can see that some pips follow the trend while others move against it.
4. THREE TRENDLINE TRADING STRATEGIES
Trendlines are practical tools for tracking and trading trends. Developing trading strategies with this simple yet powerful tool is highly effective.
4.1. Price bouncing off the Trendline
This is the classic pullback trading style. Here, price action suggests that the trend (marked by the trendline) will continue. In an uptrend, the market will bounce off the upper side of the trendline. Conversely, in a downtrend, the market will find resistance and bounce downward from the trendline. There are two approaches to this trading strategy.
Note: Wait for a price pattern confirmation before entering a trade. An example is shown below.
The price consistently bounces upward after touching the trendline. After three points of contact, the uptrend can be confirmed, and traders can start looking for buying opportunities.
Another method is to place a limit order when the price touches the trendline. This allows you to enter at a better price if the market continues its trend. However, due to the lack of confirmation, its success rate is usually lower.
4.2. Price Breaking a Secondary Trendline
In this case, you’re looking for a smaller trendline that moves against the primary trend.
The advantage of this strategy is that it uses a single trendline for two purposes: identifying the pullback and triggering the trade.
As shown in the example above, this trading strategy guides us toward the primary trend. The trigger is the break of the secondary trendline.
Let’s dive into the details. There are several ways to define a trendline break. To use it as an effective trigger, you need to know what criteria you’ll apply.
You can consider a trendline broken when:
– The market trades through it at a certain price level.
– A candlestick closes outside the trendline.
Waiting for a candlestick to close helps confirm a valid trendline break. However, there’s a downside: in a volatile market, you may miss the chance to enter before the trend moves quickly to a new high or low.
This trading strategy requires a secondary trendline to form against the current trend.
4.3. Price Breaking the Trendline – Reversal Signal
A primary trendline tracks the main trend. Therefore, when it breaks, it acts as a reversal signal based on technical analysis.
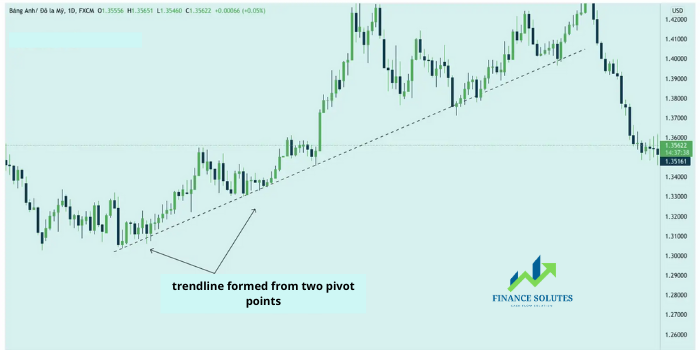
The chart above is a classic example. Although many new traders might think this strategy is flawless, that’s not the case. In reality, the trendline tracking the market is often broken multiple times before a true reversal occurs.
Well-established trends rarely reverse sharply without other signals. Typically, you’ll notice changes in volume and price action before a strong reversal. Use these signals to strengthen your trading strategy.
You can also combine this with other tools and technical indicators that show divergence or reversal signals. Don’t rely on it alone.
5. SUMMARY
In this article, Finance Solutes has shared essential information about Trendlines. Hopefully, you now understand what trendlines are, how to draw them, and how to apply them effectively in market analysis. Mastering this tool can significantly enhance your success in Forex trading.
Wishing you success in your trading journey!
- t.me/finance_solutes
- Website: https://finance-solutes.com
- Hotline: +1 929 5636 439 ( Hotline )
- 26 Broadway, Suite 934, New York, 10004, US
