
 XM
XM Bybit
Bybit Binance
 Robinhood
 Webull
 IC Markets
 Pepperstone
 OKX
OKX Vantage
 VT Markets
 BingX
BingX Gate.io
 Kucoin
 MEXC
MEXC Exness
 Bitget
Fibonacci Fan is a term developed based on the concept of the Fibonacci Sequence. So, what is the Fibonacci Fan? How can traders use the Fibonacci Fan in forex trading?
1. WHAT IS THE FIBONACCI FAN?
The Fibonacci Sequence is a series of natural numbers that starts with 0; each subsequent number is the sum of the two preceding numbers. The Fibonacci sequence looks like this: 0, 1, 1, 2, 3, 5, 8, 13, 21, 34, 55, 89, 144, 233, …
Fibonacci Fans are one of the terms developed from the Fibonacci sequence, alongside Fibonacci Retracements, Fibonacci Time Zones, and Fibonacci Arcs. However, Fibonacci Fans are often overlooked in technical analysis trading.
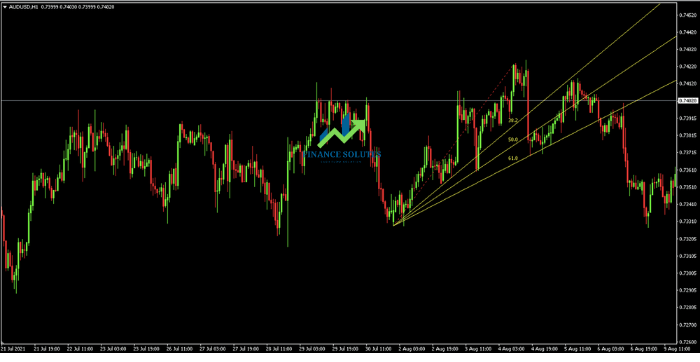
In simple terms, the Fibonacci Fan is a group of trend lines based on Fibonacci Retracement levels. The upward Fibonacci Fan extends from the bottom and passes through retracement levels based on the increase (from bottom to top). These Fibonacci Fans can then be used to estimate support levels or potential reversal zones. Below is a Fibonacci Fan chart in an uptrend.
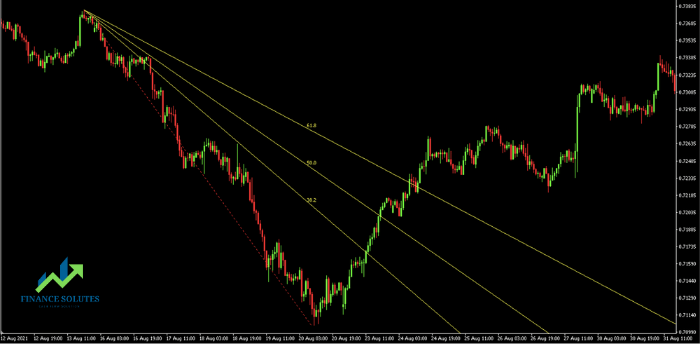
Conversely, the downward fan lines extend from the top and pass through Fibonacci retracement levels based on the decline (from top to bottom). These Fibonacci Fans can then be used to estimate resistance levels or potential reversal zones. Let’s take a look at the Fibonacci Fan chart in a downtrend below.
2. HOW TO DRAW A FIBONACCI FAN
Similar to other articles, this one will guide traders on how to open the Fibonacci Fan on the MT4 and TradingView platforms, as these are the two most widely used charting platforms among traders. The three Fibonacci fan lines that appear on the chart predict strong support and resistance levels for the market in the near future.
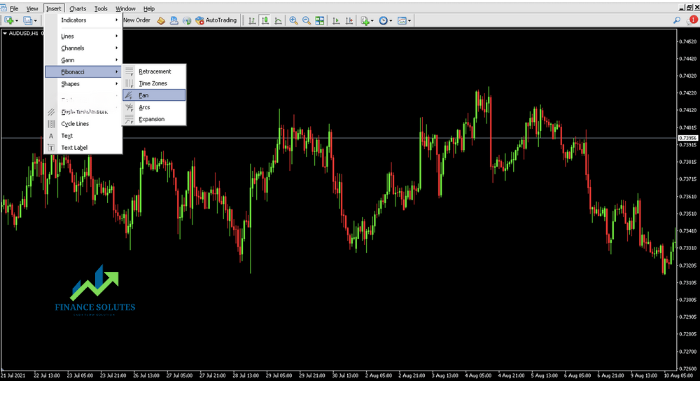
In MT4, go to the Insert section on the Menu bar → Select Fibonacci → Choose Fan (See the image below).
And to draw the fan chart, you first need to identify the market trend. If it’s an uptrend, drag the Fibonacci Fan tool from the lowest point to the highest point over a specific period. Do the opposite for a downtrend.
As for TradingView, open the chart of the currency pair you want to analyze. Then, go to the drawing tools on the far left side and select the Fib Speed Resistance Fan tool.
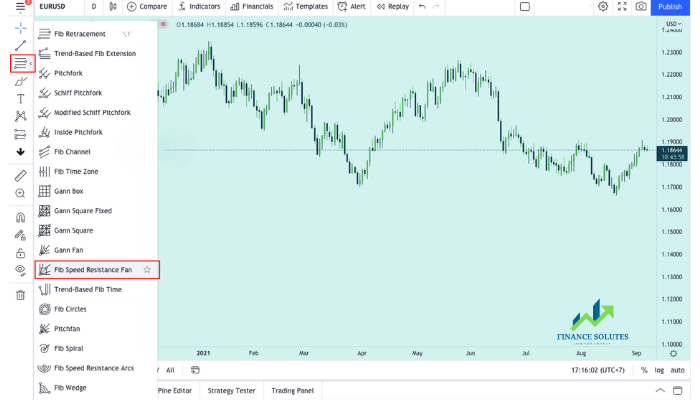
After selecting the Fibonacci Fan tool, the drawing method is similar to that in MT4.
3. EFFECTIVE TRADING STRATEGIES WITH FIBONACCI FAN
Fibonacci Fan lines can act as support and resistance zones where prices may reverse. Right after a correction begins, Fibonacci Fans highlight the areas you need to pay close attention to.
3.1. Buy Trade Strategy
A buy position is initiated when traders spot the following signals on the chart
– Price retraces to one of the Fibonacci Fan lines. When touching this line, the price must bounce back — meaning it touches the fan line but does not close below it.
– Once a candle has touched a Fibonacci Fan line without closing below it, place a buy order at the opening of the next candle. If the triggering candle closes at some distance from the fan line, wait for the price to pull back again before entering the buy order.
Take a look at the AUD/USD fan chart example below:
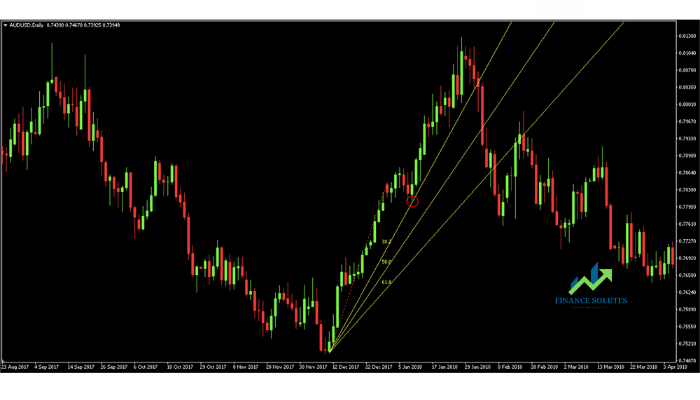
As seen, the price retraced to the 38.2% Fibonacci Fan line but only touched it without closing below. According to the rules mentioned earlier, traders enter the trade at the opening of the next candle. The stop-loss is placed at the Fibonacci Fan line right below the one tested by the price to enter the trade.
3.2. Sell Trade Strategy
For sell trades, we look for similar signals as the buy trade, but in a downtrend, and the conditions are the reverse of the buy strategy:
– The price bounces off the downward-sloping Fibonacci Fan line. In the fan chart below, the highest point of the candle breaks above the 38.2% Fibonacci Fan line but does not close above that line.
– Enter the sell trade at the opening of the next candle. It’s also crucial to set a stop-loss. Just like with the buy trade, the stop-loss is placed at the Fibonacci Fan line right above the one tested by the price to enter the trade. In this case, it’s at the 50.0% level.
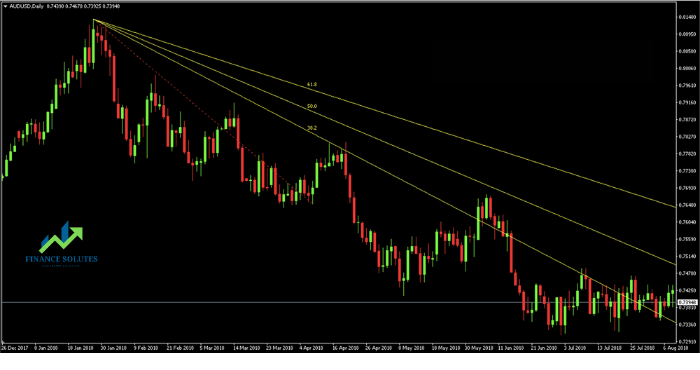
Note: The price retracing to the 61.8% Fibonacci Fan level, known as the “golden ratio”, is rare. However, this level provides the strongest support/resistance among the three levels.
4. SUMMARY
Traders use fibonacci fans for support resistance and trend speed. Traders will use fibonacci fans by dragging from one point to another.
Due to the nature of Fibonacci fans, the longer the lines are (over time), the more sensitive they are to the exact location of those two points. This means that a small change in the location of either marker can lead to larger movements further apart in the extended lines. Fibonacci fans tend to become less accurate as they get longer.
So an important note about this forex knowledge: traders when entering orders must absolutely not forget to set stop losses and have a suitable risk management strategy. Wish you all the best and successful trading!
- t.me/finance_solutes
- Website: https://finance-solutes.com
- Hotline: +1 929 5636 439 ( Hotline )
- 26 Broadway, Suite 934, New York, 10004, US
