
 XM
XM Bybit
Bybit Binance
 Robinhood
 Webull
 IC Markets
 Pepperstone
 OKX
OKX Vantage
 VT Markets
 BingX
BingX Gate.io
 Kucoin
 MEXC
MEXC Exness
 Bitget
The Piercing Pattern is a candlestick pattern consisting of two candles, indicating a potential bullish reversal in the forex market. This pattern should not be used in isolation but combined with other supporting technical tools to confirm a clear signal.
1. WHAT IS THE PIERCING PATTERN?
The Piercing Pattern is considered a bullish reversal Japanese candlestick pattern that forms at the bottom of a downtrend. It often signals a trend reversal when more buyers enter the market and push prices higher.
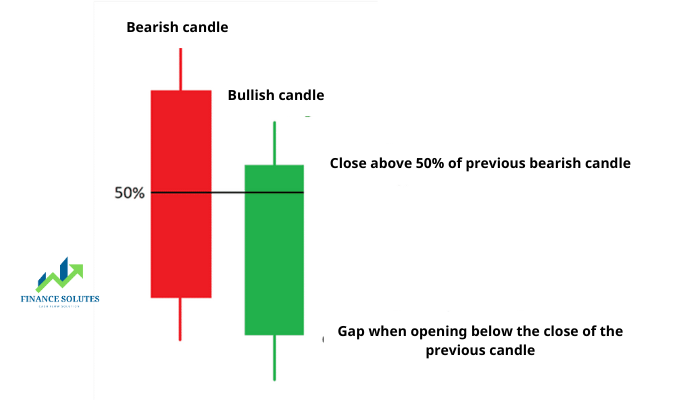
This pattern consists of two candles, with the second bullish candle opening lower than the previous bearish candle. Buyers then push the price up, closing above the 50% level of the bearish candle’s body.
The image below illustrates the characteristics of the two candles that form the Piercing Pattern:
2. THE PIERCING PATTERN
Characteristics of the Piercing Pattern
– Occurs at the bottom of a downtrend
– Consists of one bearish candle and one bullish candle
– The bullish candle opens lower than the closing price of the bearish candle
– The bullish candle then closes above the 50% level of the bearish candle’s body
Significance of the Piercing Pattern
– Indicates a potential reversal to an upward trend (bullish reversal)
– Sellers are losing momentum at this critical price level
Mechanism of the Piercing Pattern
The Piercing Pattern spans two days, with the first day influenced by sellers’ decisions and the second day reflecting strong buyer activity in the market.
This pattern signals that the supply of stocks from sellers has partially depleted, pushing the price low enough to attract buying demand. This momentum serves as a reliable indicator of a short-term upward trend.
2.1. Formation of the Piercing Pattern
The Piercing Pattern is one of the key candlestick patterns in fundamental forex knowledge, frequently analyzed on price charts. It forms with two consecutive candles and has three essential characteristics traders should note:
- Before the Piercing Pattern, there is a downtrend (it can be a short-term downtrend, but if the first candle appears after an uptrend, it does not clearly indicate a reversal).
- On the second day, a gap down occurs at the opening. The Piercing Pattern is most commonly observed in stock price charts, where overnight price gaps can appear, unlike currencies or other short-term trading assets. However, this pattern can still form on the price charts of any asset, especially on weekly time frames.
- The second candle must close above the midpoint of the first candle’s body. This indicates that buyers overpowered sellers on the second day. The first candle is usually dark or red, representing a bearish day, while the second candle is often green or light-colored, indicating a bullish day with a closing price higher than the opening price.
In summary, the Piercing Pattern is a signal that can indicate an unexpected reversal for most market participants!
2.2. Combining the Piercing Pattern with Bullish Engulfing
– Easy to identify for both novice and experienced traders
– Offers an attractive risk-to-reward ratio
– Desired entry points can be seen after properly confirming this pattern
3. TRADING WITH THE PIERCING LINE
The Piercing Line pattern is highlighted with a blue box on the chart. Before this pattern, there is a strong downtrend indicated by lower highs and lower lows. This example illustrates using price action to identify the downtrend. However, traders often prefer using a technical indicator like the moving average for confirmation (the price needs to be above the long-term moving average).
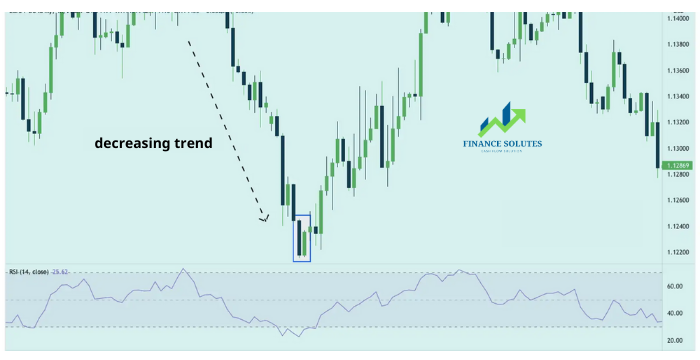
As mentioned earlier, the Piercing Line pattern requires additional confirmation before entering a buy trade. In this example, the RSI oscillator is used as supplementary confirmation of the reversal. From the chart, the RSI indicates an oversold signal, reinforcing the validity of this candlestick pattern.
Stop-loss levels can be set at the nearest low (the lowest point of the bullish candle in the Piercing Pattern), while take-profit (limit) levels can be determined using Fibonacci extensions or price action.
4. RELIABILITY OF THE PIERCING LINE PATTERN
The Piercing Pattern signals a bullish reversal; however, it should not be relied upon alone. Other supporting signals should be used in conjunction with this pattern. Trading against a strong trend can be very risky, so seek as many additional confirmation signals as possible to validate the pattern.
|
Advantages |
Limitations |
| – Occurs frequently in financial markets – Offers attractive risk-to-reward ratios – Easy to recognize for beginner traders |
– Only signals bullish reversal patterns – Trading with the Piercing Pattern requires combining other technical indicators and oscillators – Consider the overall market trend, not just the candlestick pattern alone. |
- t.me/finance_solutes
- Website: https://finance-solutes.com
- Hotline: +1 929 5636 439 ( Hotline )
- 26 Broadway, Suite 934, New York, 10004, US
