
 XM
XM Bybit
Bybit Binance
 Robinhood
 Webull
 IC Markets
 Pepperstone
 OKX
OKX Vantage
 VT Markets
 BingX
BingX Gate.io
 Kucoin
 MEXC
MEXC Exness
 Bitget
Bullish Candlestick Patterns – As mentioned in the overview of Japanese candlestick patterns, these patterns are an effective tool for traders, especially those who follow technical analysis. Today’s article will introduce the most common bullish reversal candlestick patterns in trading.
1. BULLISH CANDLESTICK PATTERNS
Japanese candlestick patterns are formed from individual candlesticks. They are considered a useful tool that helps technical traders predict future price movements based on past candlestick patterns.
A bullish candlestick pattern is part of the Japanese candlestick system. Over a specific period, a bullish candlestick has a closing price higher than its opening price. Bullish candlestick patterns are divided into two main types: bullish reversal patterns and bullish continuation patterns. This article will focus solely on bullish reversal patterns.
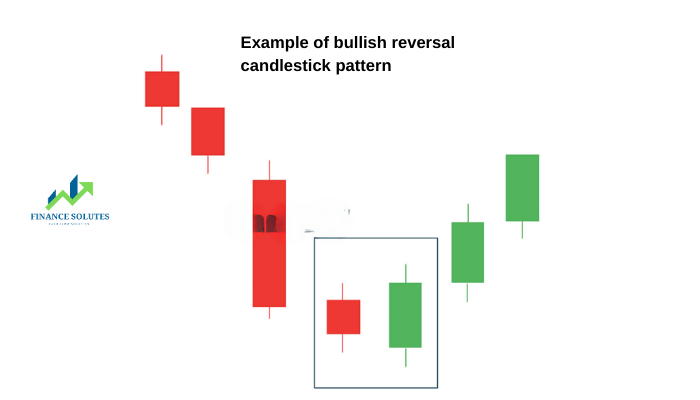
Technical traders use bullish reversal candlestick patterns to predict when a downtrend may end and a recovery could begin. For a pattern to be considered a bullish reversal, the market prior to the pattern must be in a downtrend. If any of the bullish patterns below form in an uptrend, they are considered continuation patterns rather than reversal patterns.
Bullish reversal candlestick patterns tend to appear at the bottom of a downtrend or during a consolidation phase after the downtrend has ended. Let’s explore the most common bullish reversal patterns below.
2. TOP 5 MOST COMMON BULLISH REVERSAL CANDLESTICK PATTERNS
Below, Finance Solutes will summarize the top 5 most commonly used bullish reversal candlestick patterns by traders.
2.1. Hammer Candlestick Pattern
The hammer candlestick pattern is a bullish reversal pattern that signals the price has almost reached the bottom of the downtrend and is about to reverse upwards. It is called the “hammer” because the shape of the candlestick looks like a hammer. The hammer candlestick forms when sellers push the price lower during the session, but then strong buying pressure drives the price back up, causing the closing price to be above the opening price.
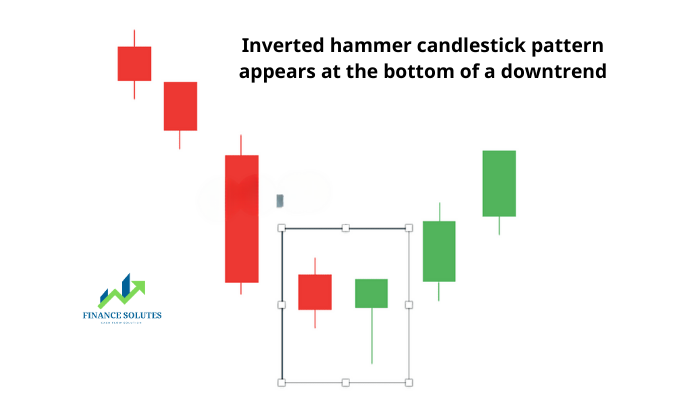
A bullish hammer candlestick typically has a short body, with a small or absent upper shadow and a particularly long lower shadow. The lower shadow should be at least twice the length of the body.
Additionally, there is a variation of the hammer pattern called the Inverted Hammer. The inverted hammer also forms at the bottom of a downtrend and signals a potential reversal. The characteristics of the inverted hammer are similar to those of the regular hammer, but the upper shadow of the inverted hammer is long, while the lower shadow is short or almost nonexistent.
2.2. Bullish Engulfing Candlestick Pattern
The Bullish Engulfing pattern is a reversal pattern consisting of two candles. In this pattern, the green bullish candlestick that follows is larger and “engulfs” the preceding red bearish candlestick (completely covering the previous bearish candlestick). Note: The colors of the green and red candles may vary depending on the trader. However, the common color scheme for a bullish candle is green and for a bearish candle is red in trading.
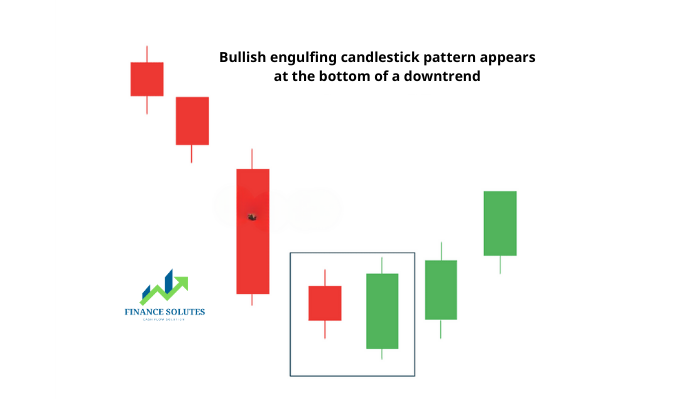
The greater the size difference between the two candles in a Bullish Engulfing pattern, the stronger the reversal signal. Ideally, the entire body and shadow of the bullish candle should engulf and cover the entire body and shadow of the preceding bearish candle. Traders may enter a buy position when the price moves higher than the high of the bullish candlestick in the Bullish Engulfing pattern. In other words, the reversal of the downtrend has been confirmed.
2.3. Piercing Line Candlestick Pattern
The Piercing Line pattern also consists of two individual candles: a red bearish candlestick followed by a green bullish candlestick. This pattern appears within a downtrend.
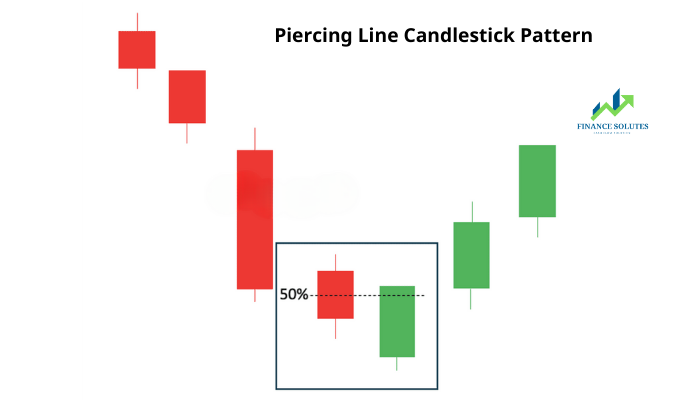
The first red candlestick is long and bearish. A green bullish candlestick then appears, with its opening price below the closing price of the previous bearish candlestick, creating a gap down. This forms a Bullish Piercing Pattern, where the bullish candlestick closes above 50% of the previous red candlestick. Both candlesticks have long bodies.
2.4. Morning Star Candlestick Pattern
The Morning Star is a three-candle pattern in Japanese candlestick analysis. The second candle, which is in the middle, is usually a Doji or a candle with an opening and closing price that are very close to each other (it doesn’t matter whether it’s bullish or bearish). The first candle is a long bearish candle, and the third is a bullish candlestick.
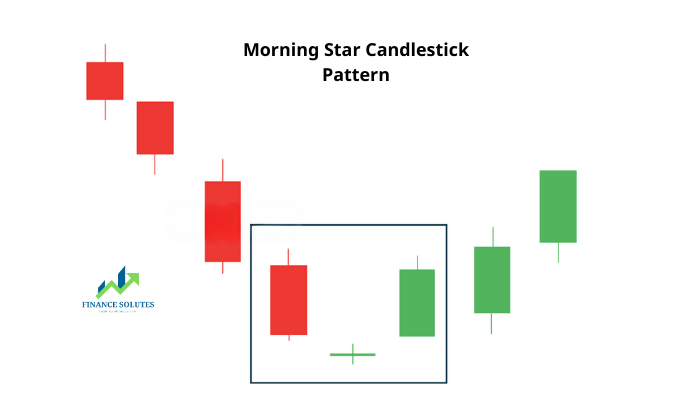
After a long bearish candlestick, a gap down forms. At this point, the bears are in control, but not overwhelmingly so. The second candle is quite small, and its color is not important, although it would be better if it is a bullish candlestick. The third bullish candlestick opens with a gap up, filling the previous gap down.
2.5. Three White Soldiers Candlestick Pattern
The Three White Soldiers pattern consists of three consecutive bullish candlesticks with progressively higher closing prices. This bullish candlestick pattern signals a trend reversal, indicating strong buying pressure.
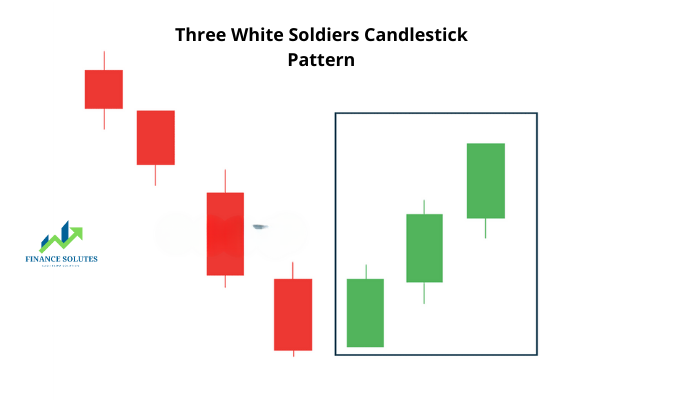
Traders should be cautious when they spot this pattern, as sometimes, excessively long candlesticks can attract sellers, which may push the price lower.
3. SUMMARY
Above, Finance Solutes has introduced the most common bullish candlestick patterns that signal a potential market reversal. Remember, these patterns are only considered bullish reversal patterns when they appear at the end of a downtrend, or when the downtrend has ended and the price is in a consolidation phase. If they appear in other conditions, they are considered continuation patterns.
We hope this article has helped you learn more about useful Japanese candlestick patterns. Traders can expand their forex knowledge by learning how to identify and predict price trends in the market.
Wishing you successful and profitable trading!
- t.me/finance_solutes
- Website: https://finance-solutes.com
- Hotline: +1 929 5636 439 ( Hotline )
- 26 Broadway, Suite 934, New York, 10004, US
