
 XM
XM Bybit
Bybit Binance
 Robinhood
 Webull
 IC Markets
 Pepperstone
 OKX
OKX Vantage
 VT Markets
 BingX
BingX Gate.io
 Kucoin
 MEXC
MEXC Exness
 Bitget
Continuing the series of articles about what a Pinbar is in Forex, today Finance Solutes will introduce to you a strategy considered to be the most effective when trading with Pinbar candles, which is the Pinbar trading strategy based on support and resistance levels. So how is this strategy applied on a real Forex chart? Let’s find out with Finance Solutes in today’s article.
1. OVERVIEW OF PINBAR
As mentioned in the previous article, the Pinbar is a candlestick pattern with a special shape, consisting of a long wick compared to its body. The long wick indicates the market’s rejection of price when one of the two sides tries to push the price in their desired direction, but the pressure from the opposing side is stronger, causing the price to move in the opposite direction.
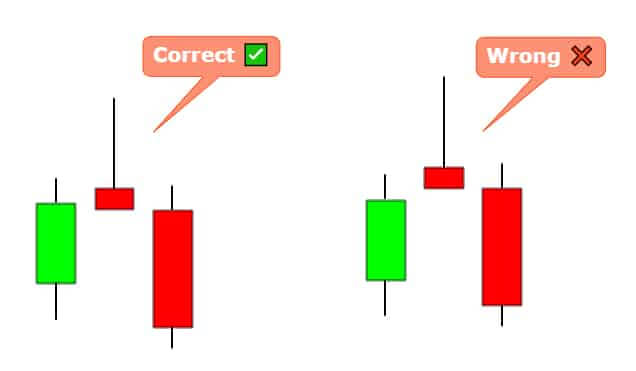
In the Price Action trading style, the Pinbar is used as a strong reversal pattern. It is almost suitable for all trading instruments across all financial markets such as stocks, Forex, or cryptocurrencies, etc.
2. PINBAR TRADING STRATEGY BASED ON SUPPORT AND RESISTANCE LEVELS
The Pinbar with support and resistance is considered one of the most effective strategies when trading with Pinbar candles. Pinbars often appear at retracement levels or within a trend, acting as continuation signals. When combined with strong support and resistance levels, it can be one of the most accurate trading signals.
Let’s take a look at the Daily chart of the EURUSD pair below; two consecutive Pinbars test the previous support and resistance levels, after which the price continues to decline.
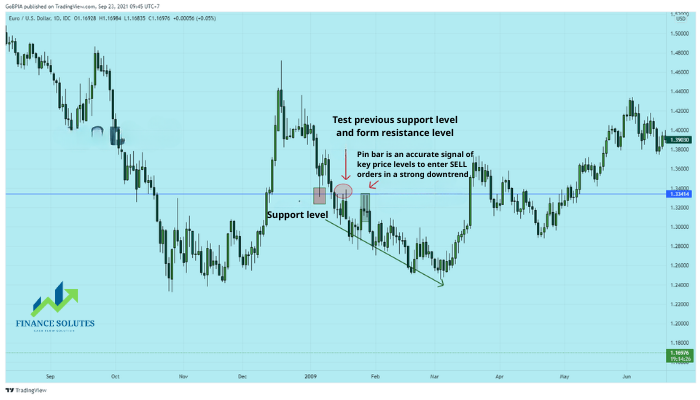
The Pinbar can form in all market conditions (up, down, sideways, etc.). Therefore, traders can look for a strategy with potential profits around Pinbar candlestick patterns, especially when combined with other signals or indicators.
Continuing to observe the example below, you can see on the chart of the GBPUSD pair, a Pinbar appears at the previous support/resistance level within an uptrend, and it also coincides with the 50% Fibonacci Retracement level.
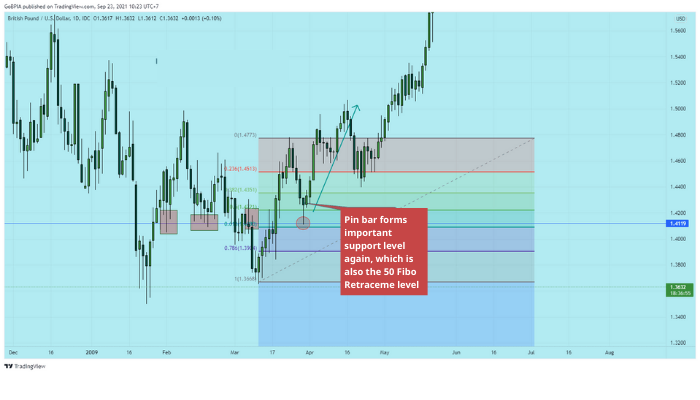
The Pinbar can be used in the constantly fluctuating Forex market and can also be effective in a Sideways market, especially when combined with support and resistance levels.
On the chart of EURJPY below, two reversal Pinbars have formed a support level in a Sideways market condition.
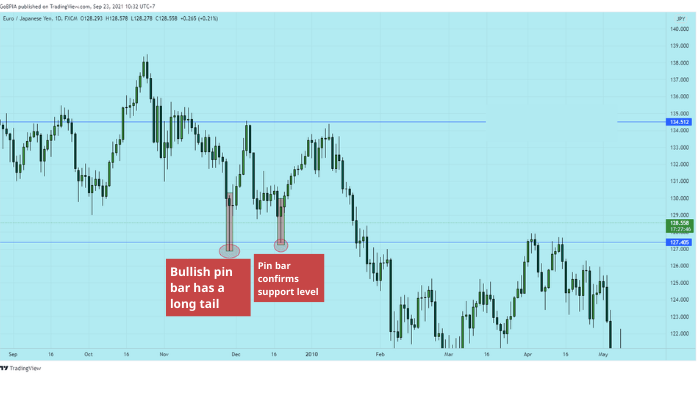
The Pinbar can also be applied at reversal points in conditions where the price is moving strongly.
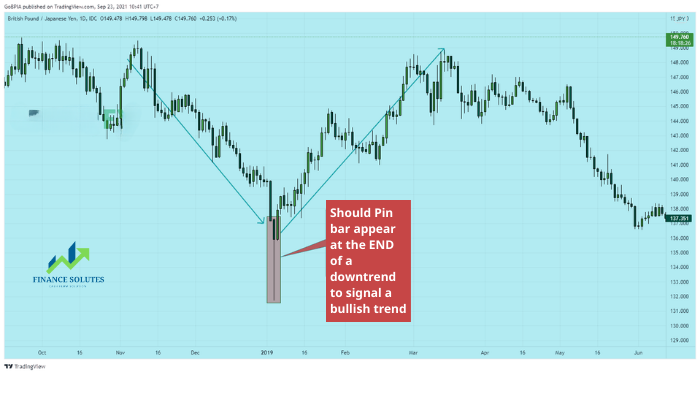
The price chart of the GBPJPY pair below shows a Pinbar that forms when the downtrend is strong, and then the price reverses into an uptrend. This reversal point forms a “V” bottom, with the bottom being the bullish Pinbar.
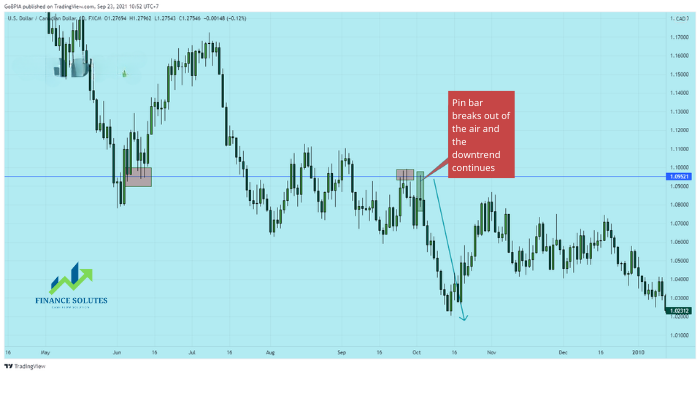
When a Pinbar appears at the top/bottom of a trading range, it signals that the price will continue in the direction of the previous trend.
Looking at an example on the USDCAD chart, you can see that multiple Pinbars were formed above the trading range. Previously, the price was in a strong downtrend. The final Pinbar is a confirmation of the breakout from the trading range, continuing the previous downtrend.
Through the examples above, you can see that the Pinbar is a useful candlestick pattern for traders in all different market conditions. It works most effectively when combined with important support and resistance levels. It will be more accurate on the 1D and 1H timeframes and appears at the tops and bottoms of market ranges.
3. SUMMARY
So, in today’s article, you have learned about the Pinbar trading strategy based on support and resistance levels. This is considered a very valuable tool in Pinbar trading methods in the Forex market. We hope that what Finance Solutes has shared will assist you in your Forex investment and trading journey.
Wishing you success in your trading career!!!
- t.me/finance_solutes
- Website: https://finance-solutes.com
- Hotline: +1 929 5636 439 ( Hotline )
- 26 Broadway, Suite 934, New York, 10004, US
