
 XM
XM Bybit
Bybit Binance
 Robinhood
 Webull
 IC Markets
 Pepperstone
 OKX
OKX Vantage
 VT Markets
 BingX
BingX Gate.io
 Kucoin
 MEXC
MEXC Exness
 Bitget
To achieve stable profits, you need to know how to use the best indicators for Price Action Trading in technical analysis; from there, you can predict the future development of the market. Therefore, in today’s article, Finance Solutes will compile the best indicators for technical analysis and Price Action trading.
Let’s get started!
1. THE BEST INDICATORS FOR PRICE ACTION TRADING AND TECHNICAL ANALYSIS
Here is a compilation of the best
indicators for Price Action trading and typical technical analysis that traders trust most when trading:
1.1. Support and Resistance Levels
1.1.1. Resistance Level
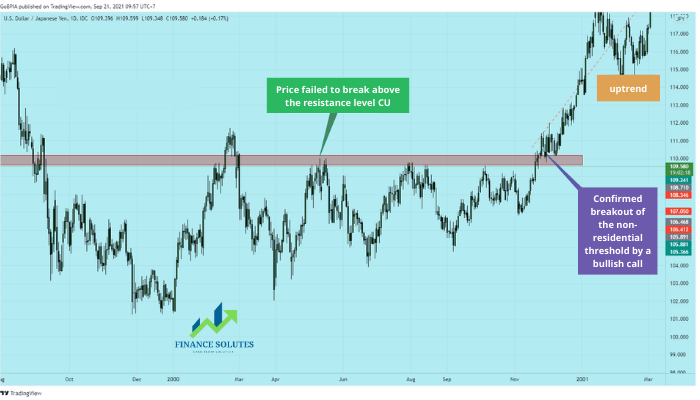
The support and resistance levels are horizontal lines that are widely used in technical analysis for Price Action trading.
A resistance level is a high price level that the market has had difficulty breaking through in the past. When the resistance level is broken, meaning when a candle and subsequent candles move above this level, it confirms an uptrend. Therefore, it could be a good time to buy.
When the resistance level is respected, meaning when the market price approaches it but cannot break through and starts a downward movement, it invalidates the uptrend. Therefore, it could be a good time to sell.
1.1.2. Support Level
A support level is a low price point that the market has struggled to break through in the past. When the support level is broken, meaning when a candle and the following candles move below this level, it confirms a downtrend. Therefore, it could be a good time to sell.
When the support level is respected, meaning when the market price approaches it but cannot break through and starts an upward movement, it invalidates the downtrend. Therefore, it could be a good time to buy.
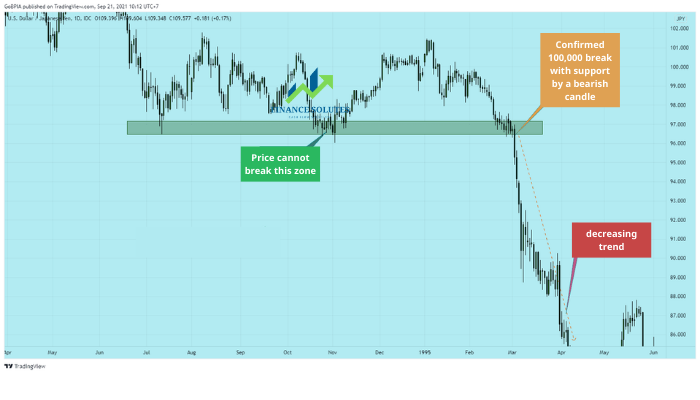
Therefore, support and resistance levels are very useful in Price Action trading.
1.2. Volume
For a selected currency pair, volume refers to the total value of trades between the two assets in the pair.
The larger the volume at a given time, the stronger the price movement. A downtrend or uptrend will tend to strengthen if there is high trading volume within the same time period.
On the other hand, if the trading volume is low, you shouldn’t focus too much on the current trend unless other trading indicators provide confidence in the reliability of this trend.
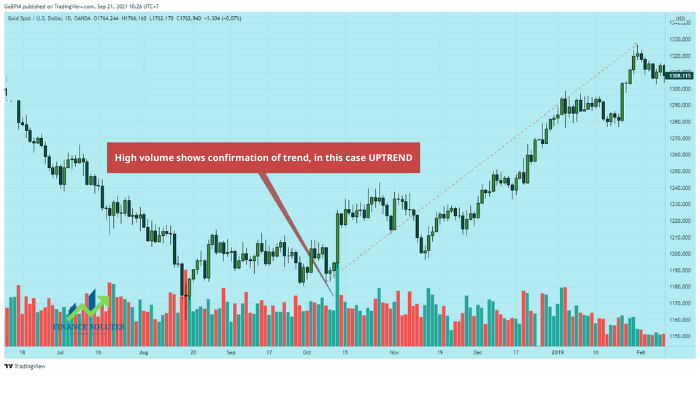
When the market price approaches the support level, high selling volume or low buying volume indicates that a support break is imminent. Meanwhile, low selling volume or high buying volume suggests that the support level will be respected.
Similarly, when the market price approaches the resistance level, high buying volume or low selling volume indicates that a resistance break is imminent. On the other hand, low buying volume or high selling volume suggests that the resistance level will be respected.
1.3. RSI Indicator
The RSI (Relative Strength Index) indicator informs traders about the strength of a market trend. It is one of the most well-known and widely used indicators in Price Action trading.
- If the RSI is above 70, the market is overbought, and the uptrend may weaken.
- If the RSI is below 30, the market is oversold, and the downtrend may start to diminish.
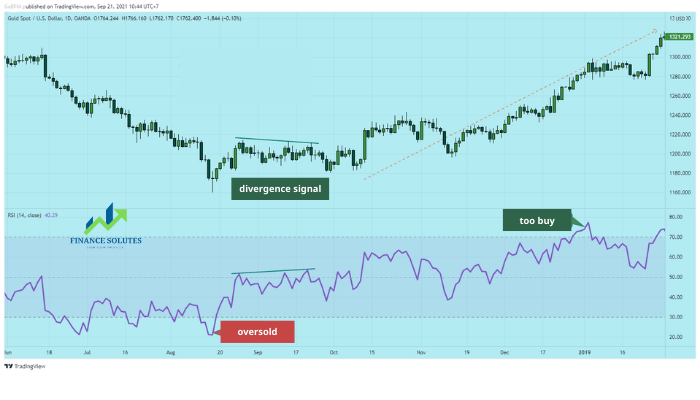
However, relying solely on the RSI indicator may not provide reliable results. We also need to consider the price development. If the price and RSI move in opposite directions, this is called an RSI divergence, and you can expect a potential trend reversal.
Over a certain period, if:
- The price decreases but the RSI increases, we are talking about a bullish divergence, with a potential upward movement.
- The price increases but the RSI decreases, we are talking about a bearish divergence, with a potential downward trend.
1.4. Simple Moving Average (SMA)
The Simple Moving Average (SMA) is the average value calculated at each point by taking all past values over a specified period. It provides a smooth price line and is one of the best indicators used in technical analysis.
- The SMA calculated over the last 20 candles is referred to as SMA20.
- The SMA calculated over the last 50 candles is referred to as SMA50.
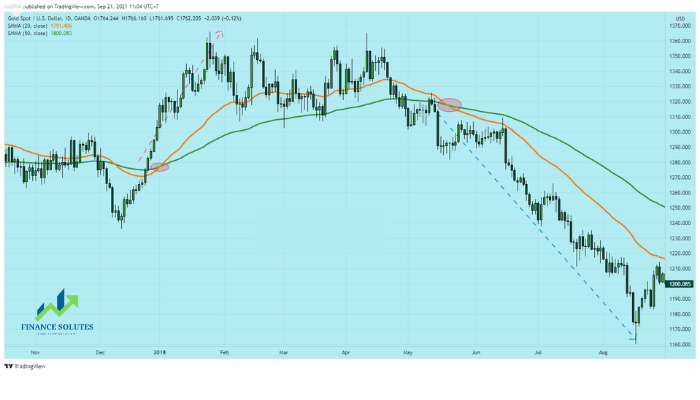
If the SMA20 is below the SMA50 and it crosses the SMA50 from below, this is a signal for an upward movement, indicating a buying opportunity.
Conversely, if the SMA20 is above the SMA50 and it crosses the SMA50 from above, this is a signal for a downward movement, indicating a selling opportunity.
The Exponential Moving Average (EMA) follows a similar principle but gives more weight to the most recent candles in its calculation.
1.5. MACD Indicator
The MACD (Moving Average Convergence Divergence) indicator is the difference between two Exponential Moving Averages (EMA) of different periods, typically the 26-period EMA and the 12-period EMA.
- MACD = EMA26 – EMA12
The MACD is combined with a second curve called the signal line, which is simply the 9-period EMA of the MACD.
- Signal Line = EMA9 of MACD
To predict market trends, we look at the point where the MACD line and the signal line cross. As shown below, the MACD line is green, and the signal line is orange.
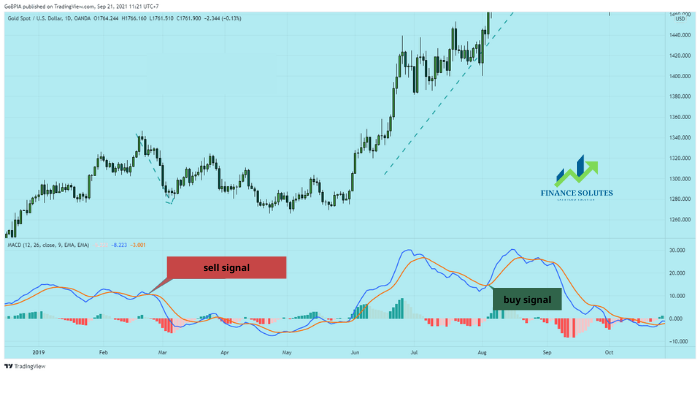
- If the MACD line crosses the signal line from below, this is a Buy signal.
- If the MACD line crosses the signal line from above, this is a Sell signal.
1.6. Stochastic Oscillator
The Stochastic Oscillator is an indicator used to identify overbought and oversold regions in Price Action trading. Its usage is quite simple, and it has values ranging from 0 to 100.
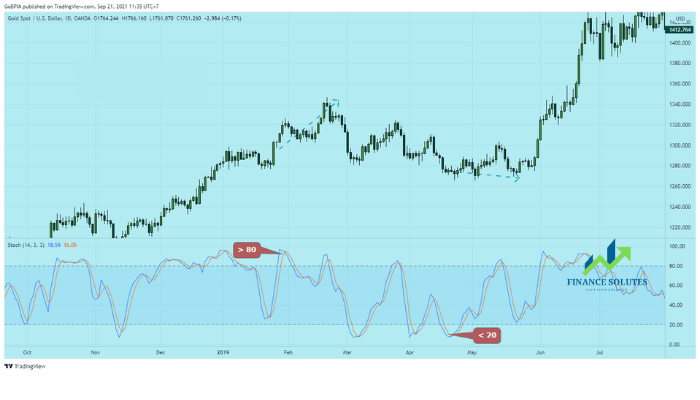
- If the Stochastic Oscillator rises above 80, we are in an overbought phase. A trend reversal is likely, and a downward movement may occur.
- If the Stochastic Oscillator falls below 20, we are in an oversold phase. A trend reversal is likely, and an upward movement may occur.
As with all other trading indicators, it should not be used alone. If it signals a trend reversal, check if other indicators are showing similar results.
1.7. Bollinger Bands Indicator
Bollinger Bands consist of three lines.
The middle line (the main line) is a moving average.
The upper and lower lines are calculated by adding or subtracting the standard deviation from the middle line, based on the last N prices.
- The further apart the upper and lower bands are, the higher the volatility.
- The closer the upper and lower bands are, the lower the volatility.
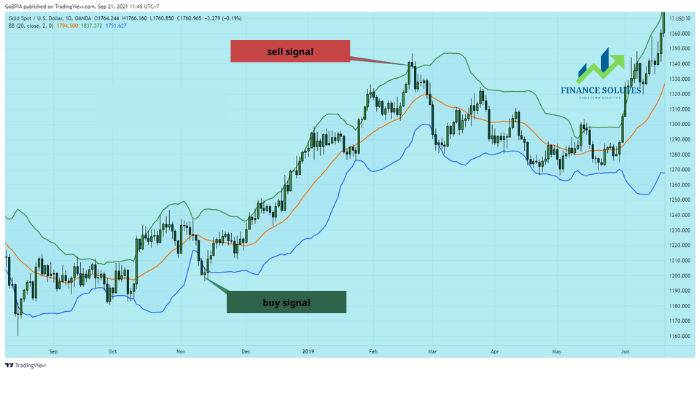
If the market price drops, breaks below the lower band, and then returns inside the bands, this is a Buy signal.
If the market price rises, breaks above the upper band, and then returns inside the bands, this is a Sell signal.
2. SUMMARY
In today’s article, Finance Solutes has introduced the best technical indicators for Price Action trading. We hope that the insights shared will be helpful to you in your investment journey and assist you in becoming a professional Price Action trader.
Wishing you success in your trading career!
- t.me/finance_solutes
- Website: https://finance-solutes.com
- Hotline: +1 929 5636 439 ( Hotline )
- 26 Broadway, Suite 934, New York, 10004, US
