
 XM
XM Bybit
Bybit Binance
 Robinhood
 Webull
 IC Markets
 Pepperstone
 OKX
OKX Vantage
 VT Markets
 BingX
BingX Gate.io
 Kucoin
 MEXC
MEXC Exness
 Bitget
The next article in the series on Japanese candlestick patterns, Finance Solutes will introduce a fairly common continuation pattern, which is the Rising and Falling Three Methods. To answer questions such as: What is the Three Methods pattern? How do you trade this pattern? Keep reading the article below!!!
1. WHAT ARE RISING AND FALLING THREE METHODS?
The Three Methods candlestick pattern is a continuation pattern that signals the ongoing momentum of the prevailing trend in the market. This pattern is used to predict the continuation of an existing trend. It consists of five candles: two strong candles in the direction of the main trend on the outside, and three smaller candles in the opposite direction in between. The three middle candles indicate a temporary pause in price action, showing that neither side has enough strength to reverse the trend.
The continuation of the current trend is anticipated to build up during this consolidation period. This consolidation is represented by the three smaller candles in the middle before the dominant trend resumes.
The Three Methods candlestick pattern is divided into two types: the Falling Three Methods and the Rising Three Methods.
2. DIFFERENTIATING RISING AND FALLING THREE METHODS
2.1. Falling Three Methods Pattern
For the Falling Three Methods pattern to be valid, the following conditions must be met:
– The current chart trend must be a downtrend.
– The first candle in the pattern is a long-bodied bearish candle.
– The next three candles are smaller bullish candles. These candles must remain within the high and low range of the first candle.
– The final candle in the next trading session is another long-bodied bearish candle.
– The closing price of the last candle must be below the body of the previous candle and also lower than the closing price of the first candle.
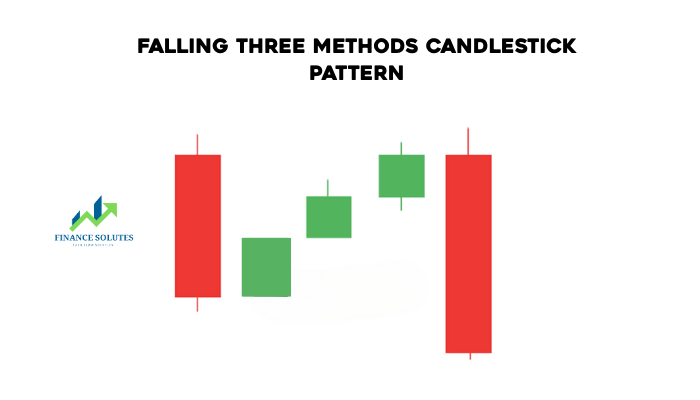
To explain the formation of the Falling Three Methods pattern, you can infer from the ongoing downtrend and the long bearish candle that initiates this candlestick pattern signal. At this point, the bears are fully in control of the market.
However, after that, the price pauses over the next three trading sessions (forming three short candles within the range of the first candle). The bulls fail to push the price above the high of the initial long bearish candle and are overpowered by the bears. Finally, in the following session, the price is pushed down again, creating another long bearish candle that closes below the first candle.
2.2. Rising Three Methods Pattern
If you see a five-candle pattern on the chart where the two outer candles are bullish and the three middle candles are bearish, this is the Rising Three Methods pattern.
The Rising Methods pattern is the bullish version of the Falling Three Methods candlestick pattern.
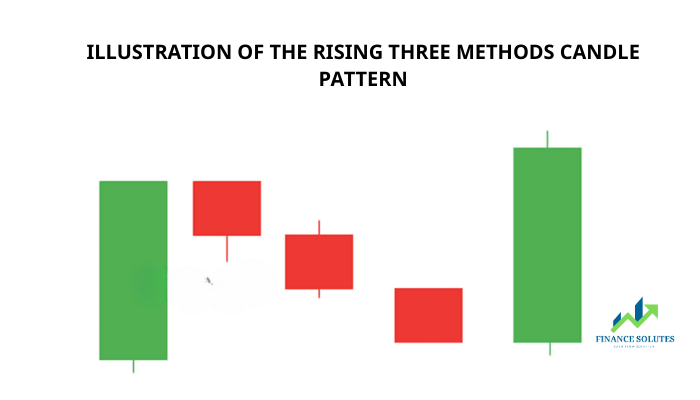
The Rising Three Methods pattern consists of at least five candles, with two strong bullish candles on the outside and three (or more) bearish candles in between, as illustrated in the chart below.
To be considered valid, the Rising Three Methods pattern must also meet the following criteria:
– The first candle is a bullish candle with a large body.
– The first candle is followed by three bearish candles. The bodies of these bearish candles must be smaller than the body of the first candle, and they must not break below the low of the first candle.
– The final candle is a strong bullish candle that completes the pattern.
– The closing price of the last candle should be above the high of the first candle. Its body should also be as long as that of the first candle.
The first candle being a long-bodied bullish candle indicates that the bulls are stronger than the bears. However, in the following three candles, the bears are unable to push the price below the low of the initial bullish candle. Eventually, the price is pushed back up, creating a long bullish candle that closes above the high of the first candle.
3. HOW TO TRADE THE RISING AND FALLING THREE METHODS PATTERNS
The Three Methods pattern offers traders a brief pause in price movement—an opportunity to enter a new position or add to an existing one.
When it comes to trading in financial markets, we need to follow certain rules. Once the conditions of this pattern are fulfilled, we can proceed with a trade.
3.1. Entry Point
A sell trade can be executed once the final candle of the Falling Three Methods pattern closes—in other words, when the pattern is completed. However, to confirm the signal, traders are encouraged to use additional indicators or tools.
For example, traders might wait for the 10-period moving average (MA) to slope downward and approach the high of the fifth candle in the pattern, as confirmation that the market is in a downtrend.
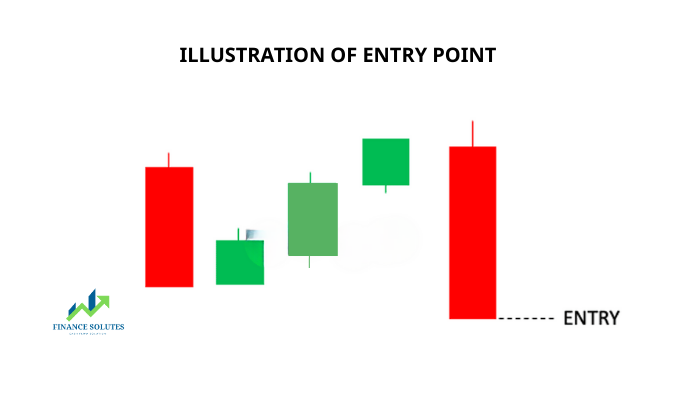
Since the Falling Three Methods is a bearish continuation pattern, traders should only look for selling opportunities when it appears. In all cases, traders should closely monitor the final candle, as the pattern only becomes valid after the last candle closes.
Likewise, the Rising Three Methods pattern can be used to enter a buy trade once the final candle of the pattern is completed.
3.2. Stop Loss – Risk Management
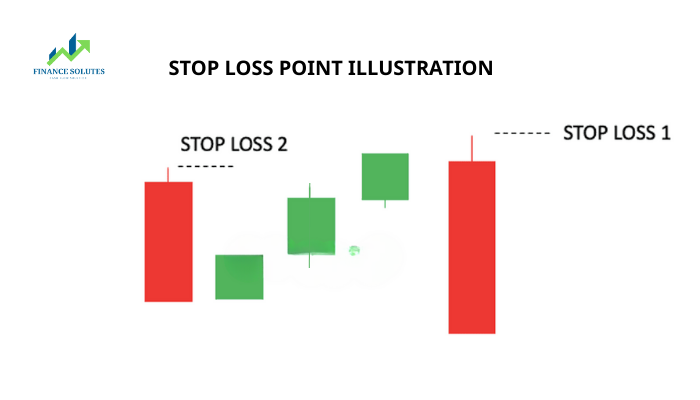
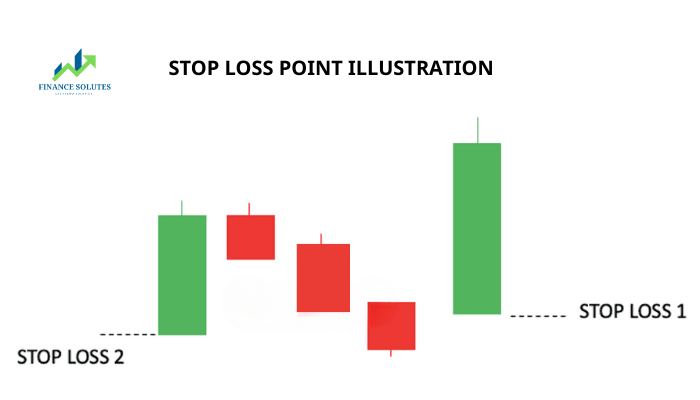
In the Three Methods pattern, the last candle is crucial as it confirms the continuation of the prevailing market trend seen in previous sessions. If the price moves above the first candle (in a bearish pattern), the setup becomes invalid.
Therefore, traders should place their stop loss above the final bearish candle in the Falling Three Methods pattern. Alternatively, the stop loss can also be placed above the first candle of the pattern to manage risk more conservatively.
Traders can set their take profit at the nearest significant resistance level. In other words, choose the closest support level (in the case of a short trade) to close the position.
The same rule applies to the Rising Three Methods pattern. Traders may place their stop loss below the final bullish candle of the pattern, or below the first candle of the Rising Three Methods pattern.Take a look at the illustration below for an example of stop loss placement:
Here is a real-world example of the Falling Three Methods model:
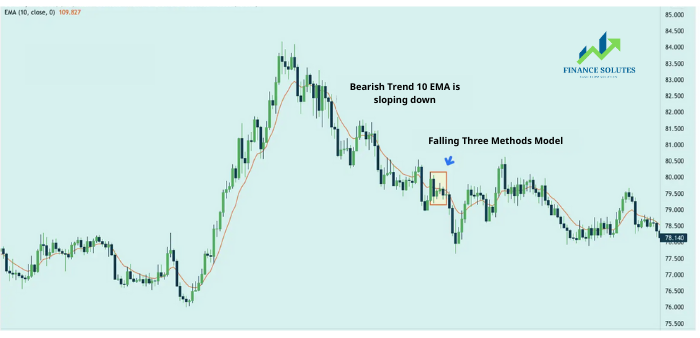
In this chart, the 10-period EMA is used, and the price mostly moves below the EMA line, confirming a downtrend. When the Falling Three Methods pattern appears, the EMA 10 is still sloping downward.
After the final candle closes as a bearish candle, the pattern is considered valid. Traders can enter the trade at this point and place the stop loss as previously guided.
4. CONCLUSION
The Rising and Falling Three Methods candlestick patterns can be an extremely effective addition to your trading strategy. However, traders should avoid relying too heavily on any single pattern. It’s best to combine these patterns with other indicators and tools for higher accuracy.
You need to apply the pattern yourself and draw insights from your own forex trading experience. Only you can manage the risks to your account and continuously improve your trading strategies and systems.
Wishing you a successful and prosperous trading day!
- t.me/finance_solutes
- Website: https://finance-solutes.com
- Hotline: +1 929 5636 439 ( Hotline )
- 26 Broadway, Suite 934, New York, 10004, US
