
 XM
XM Bybit
Bybit Binance
 Robinhood
 Webull
 IC Markets
 Pepperstone
 OKX
OKX Vantage
 VT Markets
 BingX
BingX Gate.io
 Kucoin
 MEXC
MEXC Exness
 Bitget
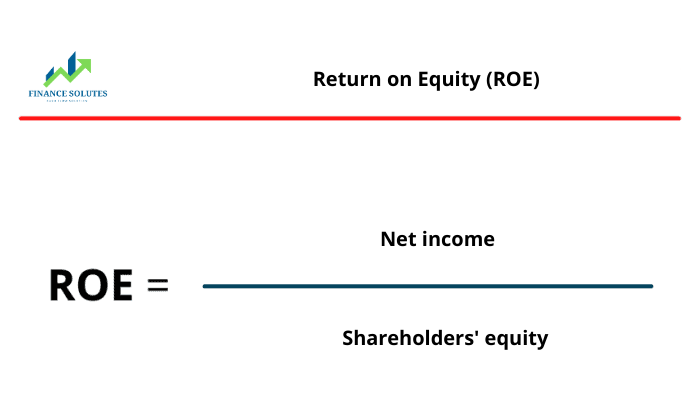
What is ROE – Return on Equity (ROE) is a measure of financial performance calculated by dividing net income by shareholders’ equity. Since shareholders’ equity is equal to a company’s assets minus its debt, ROE is considered the return on net assets.
Let’s explore more deeply with Tradafx about what ROE is, the ROE formula, the application of ROE in stocks and forex from trading knowledge; and distinguish ROE from ROA right in this article.
1. WHAT IS ROE?
ROE (Return on Equity) is the return on shareholders’ equity; it is considered a measure of a company’s annual profitability (net income) divided by the value of total shareholders’ equity, expressed as a percentage (e.g., 12%). Additionally, ROE can also be calculated by dividing the company’s dividend growth rate by the retention ratio (1 – dividend payout ratio).
The return on equity ratio is a two-part ratio because it combines the income statement and the balance sheet, in which net income or profit is compared to shareholders’ equity. This figure represents the total return on equity and shows the company’s ability to convert equity investments into profits. In other words, it measures the profit earned for each dollar from shareholders’ equity.
2. FORMULA FOR RETURN ON EQUITY (ROE)
| Term | Explanation |
|---|---|
| ROE |
|
| Net Income |
|
| Average Shareholders’ Equity |
|
2.2. How to calculate ROE?
To calculate ROE, analysts simply divide the company’s net income by its average shareholders’ equity. Since shareholders’ equity equals assets minus liabilities, ROE is essentially a measure of profit generated on a company’s net assets. The reason for using average shareholders’ equity is because this figure may fluctuate during the accounting period in question.

3. WHAT DOES ROE TELL YOU?
Whether ROE is considered good or bad often depends on the level compared to other stocks within the same industry.
A general rule of thumb for a target ROE is to be at or just above the average level within a peer group.
For example, suppose a company, TechCo, has maintained a steady ROE of 18% over the past few years, compared to the industry average of 15%. An investor might conclude that TechCo’s management is using the company’s assets to generate above-average returns. Whether a relatively high or low ROE is considered good can vary significantly across different industry groups or sectors.
When used to evaluate one company against another of similar type, the comparison becomes more meaningful. A common guideline for investors is to view return on equity close to the long-term average of the S&P 500 (14%) as an acceptable figure. ROE lower than 10% is often considered poor.
3.1. Using ROE to Estimate Growth Rate
The sustainable growth rate and the dividend growth rate can be estimated using ROE—provided the ratio is near or above the industry average. ROE is regarded as a strong indicator for forecasting a stock’s future growth rate and dividend increase rate.
A company’s future growth rate = ROE * Retention Ratio
The retention ratio is the percentage of net income that the company retains or reinvests to support future growth.
3.2. ROE and Sustainable Growth Rate
Assume there are two companies with identical ROE and net income, but different retention ratios. Company A has an ROE of 15% and returns 30% of net income to shareholders as dividends, meaning it retains 70% of its net income. Company B also has an ROE of 15% but returns only 10% of its net income to shareholders, with a retention ratio of 90%.

For Company A, the growth rate is 10.5%, or ROE multiplied by the retention ratio, which is 15% * 70%. Company B’s growth rate is 13.5%, or 15% * 90%.
This analysis is referred to as the sustainable growth rate model. Investors can use this model to make forward-looking estimates and identify stocks that may be at risk because they signal unsustainable growth potential.A stock growing at a slower pace than its retention rate may be undervalued, or the market might be pricing in potential risk signals from the company. In either case, a growth rate much higher or lower than the sustainable rate requires further clarification.
Returning to the example above, one might conclude that Company B is more attractive than Company A—but this ignores the advantage of a higher dividend payout ratio.
It’s worth noting that the calculation can be modified to estimate the dividend growth rate, which may be more important for certain investors.
3.3. Estimating the Dividend Growth Rate
Continuing with our example above:
Dividend Growth Rate = ROE x Payout Ratio
The payout ratio is the percentage of net income paid out to common shareholders in the form of dividends. This formula gives us a sustainable dividend growth rate, which favors Company A.
Company A’s dividend growth rate is 4.5%, or ROE multiplied by the payout ratio: 15% * 30%. Company B’s dividend growth rate is 1.5%, or 15% * 10%. A stock that increases its dividend at a rate significantly higher or lower than the sustainable dividend growth rate may indicate underlying risks that warrant investigation.
Have you ever wondered why an average or slightly above-average ROE is often better than an ROE that’s double, triple, or even higher than the peer group average? Isn’t a stock with a very high ROE supposed to be more valuable?
Sometimes, an extremely high ROE can be a good thing if net income is significantly large compared to shareholder equity, indicating strong operational performance. However, an excessively high ROE often results from a small equity base relative to net income, which can be risky.
3.4. Unstable Earnings
The first potential issue with a high ROE is inconsistent profitability.
3.5. Debt
The second issue that can lead to a high ROE is leverage (debt). If a company takes on heavy debt, it can boost ROE because shareholder equity equals total assets minus total liabilities. The more debt a company takes on, the lower its equity base becomes.A common scenario is when a company borrows a large amount of money to repurchase its own shares. This can increase earnings per share (EPS), but doesn’t necessarily improve actual performance or growth prospects.
3.6. Negative Net Income
Lastly, negative net income and negative shareholder equity can sometimes produce oddly high or meaningless ROE figures. If a company is reporting losses or has negative equity, ROE should not be calculated.
When shareholder equity is negative, it usually stems from excessive debt or inconsistent profitability. However, exceptions exist—for instance, profitable companies that repurchase shares aggressively, reducing equity (since buybacks are deducted from equity) enough to turn the equity figure negative.

In all cases, a negative or extremely high ROE should be considered a notable red flag. In rare exceptions, a negative ROE may be the result of a share buyback program influenced by strong cash flow and outstanding management, but such cases are uncommon. Regardless, a company with negative ROE cannot be fairly compared to stocks with positive ROE values.
4. ROE and DuPont Analysis
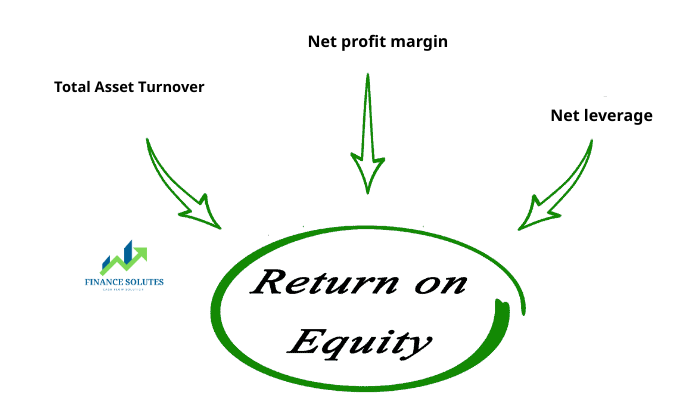
Although ROE is typically calculated by dividing net income by shareholder equity, a technique called DuPont Analysis breaks down ROE into more detailed components.
First developed by the American chemical company DuPont in the 1920s, this method helps identify which factor contributes most or least to a company’s ROE.
There are two versions of DuPont Analysis. The first and simpler version breaks ROE into three components:
ROE = NPM × Asset Turnover × Equity Multiplier
-
NPM (Net Profit Margin): A measure of operational efficiency
-
Asset Turnover: Indicates how efficiently a company uses its assets
-
Equity Multiplier: A measure of financial leverage
ROE = EBT/S x S/A x A/E x ( 1 – TR) = ETB/S x S/A x A/SE
-
EBT: Earnings before tax
-
S: Sales
-
A: Total assets
-
E / SE: Shareholder equity
-
TR: Tax rate
5. WHAT ARE ROA, ROE? HOW TO ANALYZE FINANCIAL RESULTS BY ROE AND ROA
ROA and ROE are similar in that they both attempt to assess how efficiently a company generates profits. However, while ROE compares net income to a company’s net assets, ROA compares net income to a company’s assets without subtracting liabilities. In both cases, companies in industries where operations require significant asset use will likely show lower average returns.
6. LIMITATIONS OF ROE
So what are the limitations of ROE? High ROE may not always be positive. An excessively high ROE can indicate potential issues such as inconsistent profits or excessive debt. Additionally, a negative ROE due to net losses or negative shareholders’ equity cannot be used to analyze the company nor can it be compared with companies that have positive ROE.
The return on equity ratio can also be distorted by share buybacks. When management repurchases its own shares from the market, this reduces the number of outstanding shares. As a result, ROE increases when the denominator shrinks.
Another weakness is that some ROE ratios may exclude intangible assets from shareholders’ equity. Intangible assets are non-monetary items such as goodwill, trademarks, copyrights, and patents. This can cause calculations to be distorted and make it difficult to compare with companies that have chosen to include intangible assets.
Finally, the ratio includes some variations in its components and there may be disagreements among analysts. For example, shareholders’ equity can be based on the beginning, ending, or average of both, while net income may be substituted for EBITDA and EBIT, and can be adjusted or not for non-recurring items.
- t.me/finance_solutes
- Website: https://finance-solutes.com
- Hotline: +1 929 5636 439 ( Hotline )
- 26 Broadway, Suite 934, New York, 10004, US
