
 XM
XM Bybit
Bybit Binance
 Robinhood
 Webull
 IC Markets
 Pepperstone
 OKX
OKX Vantage
 VT Markets
 BingX
BingX Gate.io
 Kucoin
 MEXC
MEXC Exness
 Bitget
On the market, prices will not continuously follow a single trend until that trend ends. Instead, there will be periods when the price moves against the main trend, and these periods are called Pullback. Today’s article will help you gain a deeper understanding of what a pullback is and introduce a highly effective 3-step pullback strategy that traders should not miss.
1. WHAT IS A PULLBACK?
What is a pullback? A pullback in forex is a phase where the price temporarily moves against the prevailing trend in order to adjust before resuming the original direction. A pullback is also known as a price correction or retracement.
The longer a trend persists, the longer the pullback phase tends to last. There are two main types of pullbacks: pullbacks within an uptrend and pullbacks within a downtrend. Below is an illustration of a pullback:
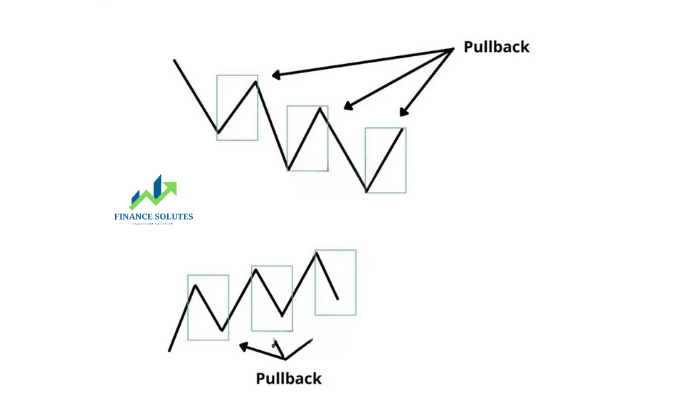
In an uptrend, the price must enter a pullback phase to adjust before pushing higher and surpassing the previous peak. Conversely, in a downtrend, the price must also enter a pullback phase to adjust before dropping lower than the previous bottom.
2. WHEN DOES A PULLBACK OCCUR?
A pullback usually occurs when the price becomes overbought or oversold, which can be identified using indicators such as RSI or MACD (or a combination of MACD and RSI) or through trendlines. After the adjustment phase ends, the price will return to the main trend. Pullbacks are considered as a resting period or a pause, allowing the price to build momentum to continue moving along the trend.
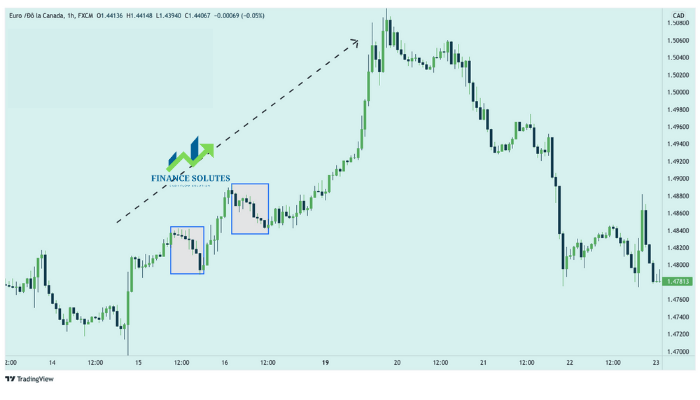
We need to distinguish between a reversal and a pullback. A reversal is more long-term in nature, signaling a trend in the opposite direction of the prevailing one.
3. DIFFERENCE BETWEEN PULLBACK AND REVERSAL
| Pullback | Reversal |
| – Often occurs during a strong fluctuation of the main trend – Short-term price movement – No specific chart patterns signal a pullback; mainly relies on technical indicators such as RSI or MACD. – In an uptrend, a pullback appears when the market is overbought, prompting a price adjustment. – In a downtrend, a pullback occurs when the market is oversold. |
– Appears after an accumulation or sideways phase – Long-term price movement – Signaled by distinctive chart patterns such as Head and Shoulders, Double Top, Double Bottom, etc. – In an uptrend, buyers lack the strength to push prices higher, causing a reversal. – In a downtrend, sellers fail to push prices lower, leading to a reversal and an upward move. |
One advantage of trading pullbacks is that you can take advantage of the opportunity to buy low and sell high. In an uptrend, when a pullback appears, you can buy at a lower price. Conversely, in a downtrend, a pullback allows you to sell at a higher price.
4. 3-STEP PULLBACK STRATEGY
This method uses the Keltner Channel to identify market momentum and tradable pullback opportunities. It relies on price action to select the best pullbacks to enter the market.
What are the three steps?
4.1. Identify Pullbacks
The crucial part of this system is the Keltner Channel. It’s a versatile trading tool that captures both trend strength and momentum.
The adjusted Keltner Channel includes most of the price activity. Therefore, when the price moves outside the channel — either above or below — it signals a trending market.
Recommended Keltner Channel settings:
– 15-period EMA
– 15-period ATR
– 2-times ATR multiple
After the price breaks out of the channel, wait for a pullback.
For a valid pullback, it must occur within a target zone. This is defined by the extent and timing of the pullback. Specifically, focus on pullbacks that:
– Retrace to 20%–80% of the Keltner Channel
– Occur within 3 to 15 candles
4.2. Enter the Trade
When the market enters the target zone, wait for one of the following triggers:
– A price bar showing short-term momentum in the direction of the trend.
– A Pin Bar formation with a long wick and a strong close back in the direction of the main trend.
4.3. Stop Loss and Profit Target
A stop loss must be set at least 2.5 ATR away.
This relatively wide stop loss acknowledges that pullbacks often take time to develop. The aim is to accommodate complex pullback structures.
A profit target should be set at a similar distance, providing an initial 1:1 risk-reward ratio. You can tighten the stop loss once the trade moves in your favor.
4.4. 3-Step Rules for Pullback Trading
| Buy Pullback Setup | Sell Pullback Setup |
|---|---|
| Price breaks out above the Keltner Channel. | Price breaks down below the Keltner Channel. |
| Price pulls back into the target zone. (*) | Price pulls back into the target zone. (*) |
| Wait for a price action entry signal to buy. | Wait for a price action entry signal to sell. |
(*) 20% to 80% of the Keltner Channel within 3 to 15 candles.
4.5. Illustration Example
In the charts below, the blue line forms the Keltner Channel, which we rely on to assess the trend. Additionally, a second Keltner Channel is added to the chart to highlight the target zone (orange dotted line). This is optional but can be a very helpful guide if you are not yet familiar with this method.
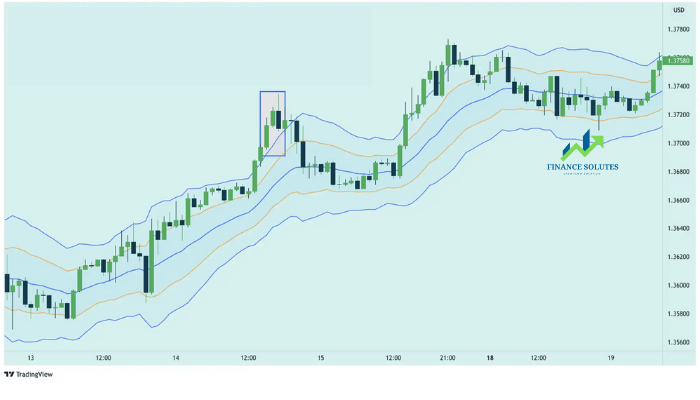
- The continuous closing of prices above the upper Keltner Channel line confirms the bullish momentum.
- After a few retracement candles touched the target zone (within the orange channel), the market shifted into a sideways movement.
- The previous candle signaled uncertainty in the form of a Doji. However, the subsequent bullish trend candle provided the momentum we needed for a buy entry.
- The market rose above the Keltner Channel again. This development set the stage for another pullback sell setup.
- A bearish pin bar at the EMA line (50% of the Keltner Channel) offered a high-quality sell entry point.
- Both setups here successfully reached the default profit target of 2.5 ATR.
5. COMMON INDICATORS USED IN PULLBACK STRATEGIES
To assist traders in executing pullback strategies, several technical indicators are commonly used. These indicators include:
5.1. Fibonacci Retracement
The Fibonacci retracement tool is well-known among traders. When trading pullbacks, the important Fibonacci retracement levels are 0.382, 0.5, and 0.618.
The stronger the trend, the shallower the retracement tends to be, often hovering around the 0.382 level.
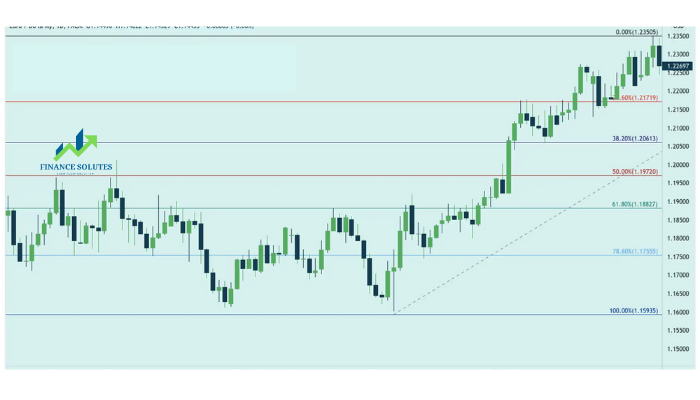
In the image above, the EUR/USD pair experienced pullback zones that coincided with the 0.786 and 0.618 levels of the Fibonacci retracement tool.
5.2. Trendlines
Using trendlines is a relatively simple method but can deliver surprisingly effective results.
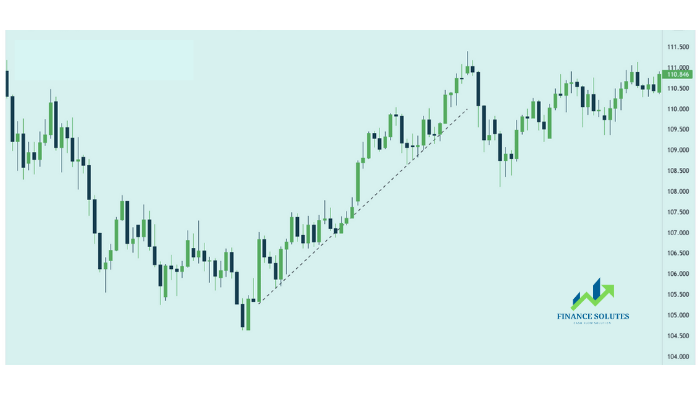
On the USD/JPY chart, the trendline depicts an uptrend. When the price falls down and touches the trendline (black dashed line), it bounces back up. If you keep following this principle, you can make a lot of money.
5.3. Moving Average (MA)
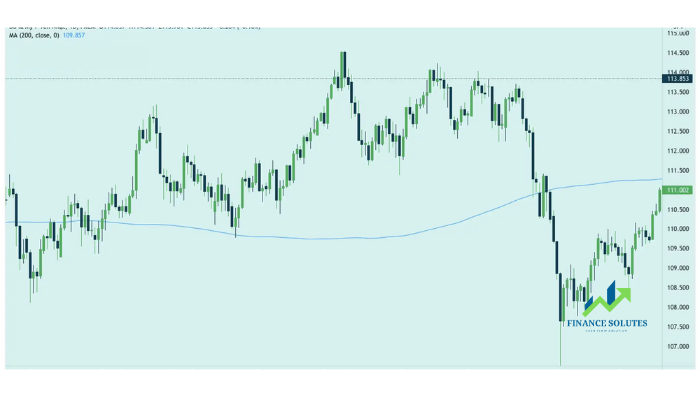
In many cases, the Moving Average (MA) is very effective for predicting pullbacks. Among the various MAs, the 200-period MA is the most trusted by traders because it reflects a long-term trend and provides high accuracy.
6. CONCLUSION
This article has introduced you to the concept of pullbacks and how to confirm pullbacks in Forex trading. The 3-step pullback strategy lays the foundation for a pullback trading method in a trending market. With this three-part trading setup, there is much for you to explore and learn. And don’t forget to set a stop loss to protect your account!
Wishing you successful trading!!!
- t.me/finance_solutes
- Website: https://finance-solutes.com
- Hotline: +1 929 5636 439 ( Hotline )
- 26 Broadway, Suite 934, New York, 10004, US
