
 XM
XM Bybit
Bybit Binance
 Robinhood
 Webull
 IC Markets
 Pepperstone
 OKX
OKX Vantage
 VT Markets
 BingX
BingX Gate.io
 Kucoin
 MEXC
MEXC Exness
 Bitget
Moving Average Strategy with Golden Cross – Golden Cross is a prominent moving average signal familiar to both technical and fundamental traders. The bearish counterpart to this signal is known as the Death Cross. While these names may sound dramatic, they offer significant value to astute traders.
From this article, you will learn how to leverage the Golden Cross setup for price action trading.
Note: This guide focuses on the Golden Cross for simplicity. However, the principles discussed can also be applied to the Death Cross.
1. WHAT IS A GOLDEN CROSS?
If this is your first time hearing about the Golden Cross, don’t worry. It’s a straightforward concept, and here’s a quick summary.
The basic setup of a Golden Cross involves two moving averages:
– A medium-term moving average
– A long-term moving average
The commonly used timeframes for these moving averages are 50 periods and 200 periods.
A Golden Cross simply refers to a bullish crossover of the two moving averages (i.e., when the 50-period moving average crosses above the 200-period moving average).
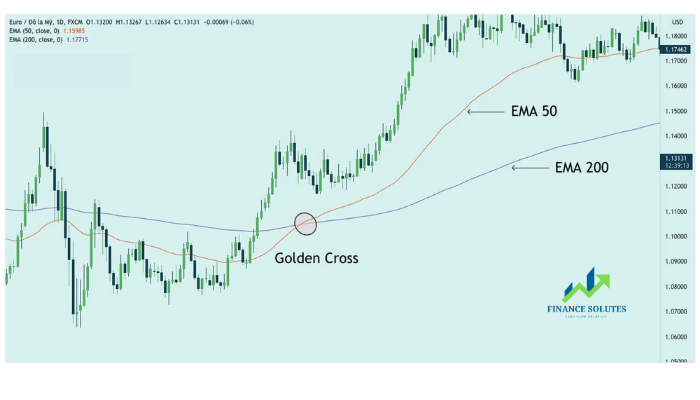
The Golden Cross shown in the chart above works effectively as a buy signal.
However, as you’ll see, a price action trader should focus less on using the Golden Cross strictly as a buy signal.
2. SHOULD YOU USE FIXED MOVING AVERAGE SETTINGS?
The parameters are not fixed, so you can modify them.
However, for our purposes, you must apply these two principles:
- Both moving averages must avoid being influenced by short-term price action. (Avoid moving averages that react sharply to price changes.)
- There must be a significant difference between the two moving averages. (For example: 50 vs. 200 is acceptable, but 180 vs. 200 will not be effective.)
These two principles are essential for a valid Golden Cross method.
They ensure two critical behaviors that contribute to useful market analysis:
- The Golden Cross is based on long-term price action
- The interaction between the two moving averages provides meaningful analysis
3. SHOULD YOU USE SMA OR EMA FOR THE GOLDEN CROSS?
For the Golden Cross, you’ll find some traders using the Simple Moving Average (SMA), while others may prefer the Exponential Moving Average (EMA).
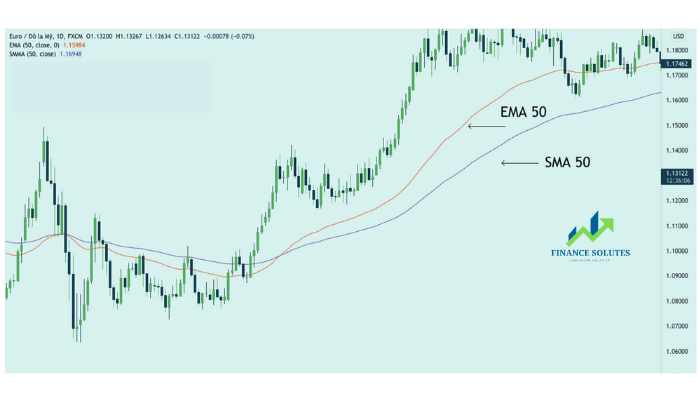
Some traders are drawn to the EMA because it responds more to price action — and in many real-world cases, they’re right to do so.
However, in our context, the goal is to focus on more solid signals for macro-level analysis. Therefore, the responsiveness of the moving average is not particularly important. In fact, if a moving average reacts too strongly to short-term price movements, it becomes harder to interpret the long-term trend.
That’s why we’ll use the SMA in this guide.
Ultimately, we want to establish the Golden Cross as a framework for macro analysis, not as a signal to trade directly. Hence, responsiveness to recent price action is not considered a benefit here.
That said, in practice, as long as you:
– Perform price action analysis
– Don’t rely solely on Golden Cross signals
Then using the EMA is acceptable.
Above all, consistency is the key factor to ensure you’re familiar with interpreting a specific type of moving average. So, choose one and stick with it.
4. PRICE ACTION GUIDE FOR THE GOLDEN CROSS FRAMEWORK
For price action traders, a common issue with using moving averages is that they can distract you from actual price movements.
To minimize this issue, establish a few ground rules.
4.1. Forget using moving averages as support and resistance zones
If you focus on spotting price bounces off moving averages, you end up trading the moving average. That’s a problem — because what you really want is to trade the price action itself.
4.2. Don’t focus on crossover signals
While the fact that a Golden Cross has occurred is relevant to our analysis, you should not rely on it as an entry signal. The exact position where the Golden Cross forms has no direct link to the current price action. Therefore, use price action patterns to find lower-risk entry points.
4.3. When in doubt about market trends, rely on price action analysis
(See the example in the next section)
5. DIFFERENT MARKET PHASES WITH THE GOLDEN CROSS
The ability to identify market phases is critical for price action traders.
To see how you can leverage the Golden Cross setup for macro-level analysis, take a look at the chart below.
5.1. Trending Phase
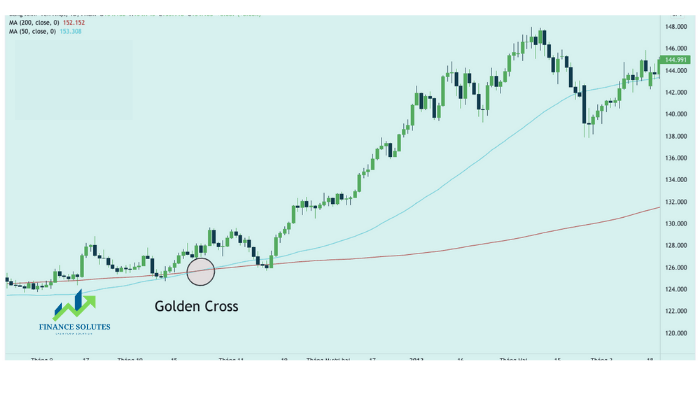
- The Golden Cross serves as a signal to pay attention to the development of an uptrend.
- Two consecutive trend extremes were broken, such as resistance zones, before transitioning into market support zones. The market structure supported a bullish premise as suggested by the Golden Cross.
(You might have missed the initial transition if you were focused on a bounce off the 200-period MA.) - The widening gap between the two moving averages highlighted the momentum of the bullish market.
5.2. Sideways or Non-Trending Phase
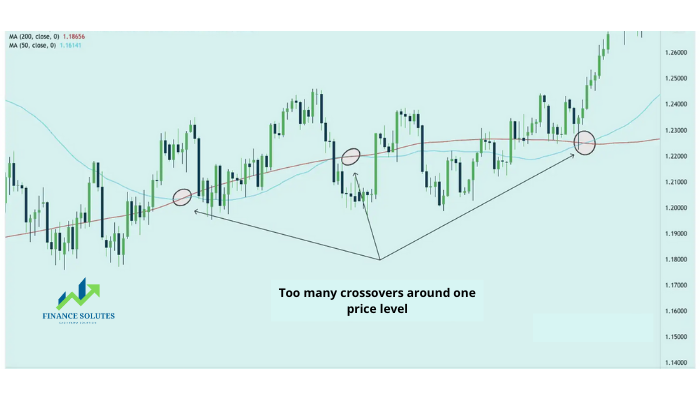
The sideways or non-trending phase has the following characteristics:
- Multiple crossovers (both Golden Cross and Death Cross) occur around similar price levels.
- Lack of follow-through after an initial push away from the 200-period MA.
- Price action whipsaws between the two moving averages.
6. ILLUSTRATIVE EXAMPLES
Let’s go through two examples. Through them, you’ll see how you can analyze the market by applying forex knowledge with the Golden Cross as a starting point.
6.1. Golden Cross in Forex
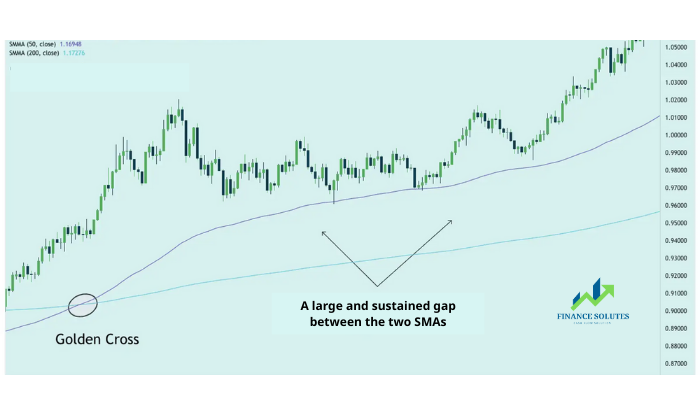
- The Golden Cross signals the beginning of a potential uptrend.
- Look at the instances where price dipped below the 50-period SMA—each time, the market rejected those dips with little difficulty. Compare this to the sideways phase discussed earlier, where you would see more overlapping candles within the middle zone.
- A clear gap between the two moving averages was maintained after the Golden Cross signal—this indicates upward momentum in the trend.
- We’re not aiming to enter trades based solely on the Golden Cross signal. Instead, we use price action patterns to enter. In this case, the consecutive bullish Anti-Climax patterns (green arrows) worked well.
6.2. Golden Cross in Stocks
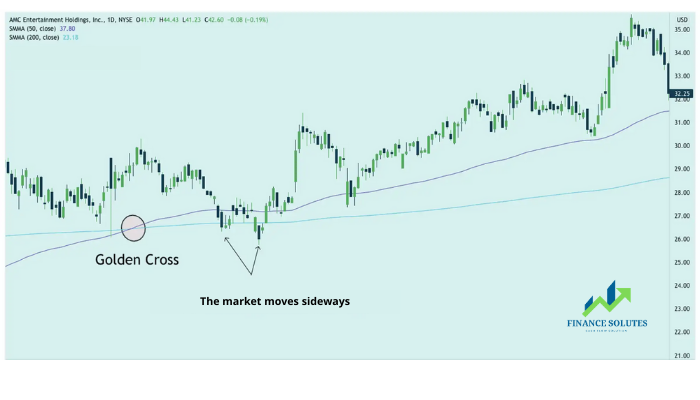
- The Golden Cross formed here, but the subsequent price action was not ideal.
- The dotted lines mark the peak of the initial bullish move above, clearly distanced from the 200-period SMA. This price clarity is important in confirming a trending phase. However, the market failed to show a clear trend around that level. (This market did attract attention due to the favorable distance between the 50 and 200 SMAs.)
- That bullish move broke the market out of its sideways accumulation. An uptrend was confirmed.
- Look at the pullback zone between the two moving averages. The first two sessions showed considerable sideways movement. But the final retracement was decisively rejected. You can see this from the strong bullish reversal that ended the pullback. It further confirms the uptrend.
- Once the uptrend was established, we began looking for price action entry points. These bullish pin bar setups made for reasonable buy entries.
Did you notice how price bounced off the 200 SMA? Don’t overlook the fact that it also rebounded from the prior accumulation zone. Above all, the sharpness of the move matters too.
These are key price action observations. And you might miss them if your only focus is on moving averages.
7. GOLDEN CROSS IN STOCKS
The Golden Cross serves as a signal for us to consider a potential shift in the market phase. Therefore, reviewing Golden Cross signals across a broad group of stocks is highly beneficial.
Ideally, you should set up a scan in your charting platform to perform seamless analysis.
8. PRICE ACTION TRADING WITH GOLDEN CROSS
The Golden Cross is valuable as an initial signal of a potential change in the long-term market trend. Once the market enters a trending phase, there are many low-risk trading opportunities. However, it’s not uncommon for the market to remain in a non-trending phase for an extended period. This is why patience is essential.
The Golden Cross is not an ideal signal for traders looking to minimize risk in short-term trades. However, for investors who rely on fundamental analysis, the Golden Cross is a useful entry trigger.
For long-term traders, precise entry points are not as critical. All they need is a signal indicating that the technical trend aligns with their bullish fundamental outlook—and that’s exactly what the Golden Cross provides.
Finally, I want to emphasize a very important point: it’s entirely possible to take a price action perspective, even when using an indicator-based strategy. This guide has outlined an approach using the Golden Cross, but you can apply the same mindset to most trading strategies.
Instead of discarding indicators, focus on aligning your analysis with price action. This way, you can always use indicators to enhance your price analysis. Of course, you must have a solid foundation to avoid being distracted by misleading indicator signals.
- t.me/finance_solutes
- Website: https://finance-solutes.com
- Hotline: +1 929 5636 439 ( Hotline )
- 26 Broadway, Suite 934, New York, 10004, US
