
 XM
XM Bybit
Bybit Binance
 Robinhood
 Webull
 IC Markets
 Pepperstone
 OKX
OKX Vantage
 VT Markets
 BingX
BingX Gate.io
 Kucoin
 MEXC
MEXC Exness
 Bitget
OBV Indicator – a leading indicator used to predict price movements based on the asset’s volume levels. For a detailed explanation of what the OBV indicator is and how to use it effectively, stay tuned for more educational trading articles from Finance Solutes!
1. WHAT IS OBV?
OBV stands for On Balance Volume, which refers to the average balanced volume. It is a technical indicator introduced by Joe Granville in his 1963 book “Granville’s New Key to Stock Market Profits.”
Granville argued that volume is the primary determining factor and, therefore, a reliable predictor of stock price movements. Although this indicator was originally applied by its “creator” solely for stock analysis, it has since been used by financial investors across various markets.
The OBV indicator was developed based on the significance of volume in price movements and is used to relatively measure the buying and selling pressure on an asset.
1.1. Formula for Calculating the OBV Indicator
The OBV Indicator is an accumulation indicator – when the price increases, it adds volume, and vice versa. Therefore, the formula for calculating OBV depends on today’s and yesterday’s closing prices:
- If today’s closing price is higher than yesterday’s:
OBV = OBV (yesterday) + Today’s volume - If today’s closing price is lower than yesterday’s:
OBV = OBV (yesterday) – Today’s volume - If today’s closing price is the same as yesterday’s:
OBV = OBV (yesterday)
The trading volume here is calculated as the most recent trading volume before the closing price.
By adding volume to the total OBV on days when the closing price increases, and subtracting it on days when the price decreases, the average volume trend, whether increasing or decreasing, typically reflects the current price trend.
1.2. Meaning of the OBV Indicator
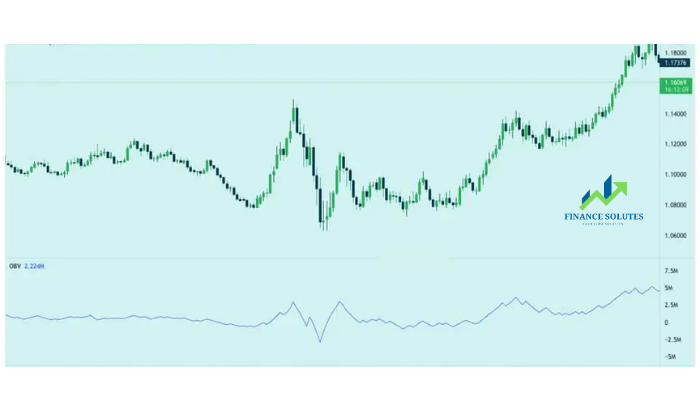
The On Balance Volume (OBV) indicator can be either positive or negative. It fluctuates around the value of 0.
On the chart, the OBV Indicator appears as a single blue line. Note that the color of the OBV line can be customized according to the trader’s preference.
The theory behind the OBV indicator is the distinction between smart money – investment funds, institutions, and retail investors. When funds begin to buy the volume that retail investors are selling, the volume can increase even when the price is still relatively low. Subsequently, the new trading volume pushes the price up, investment funds start selling, and retail investors buy again.
Instead of looking at the value of the OBV index itself, traders and analysts observe the nature of the OBV line’s movement over time, particularly the slope of the OBV line.
2. TRADINGVIEW TRADING VOLUME INDICATOR
Although the formula for calculating the OBV indicator is quite simple, traders do not need to manually calculate the OBV values. On trading platforms, traders can simply download and install the OBV indicator for use.
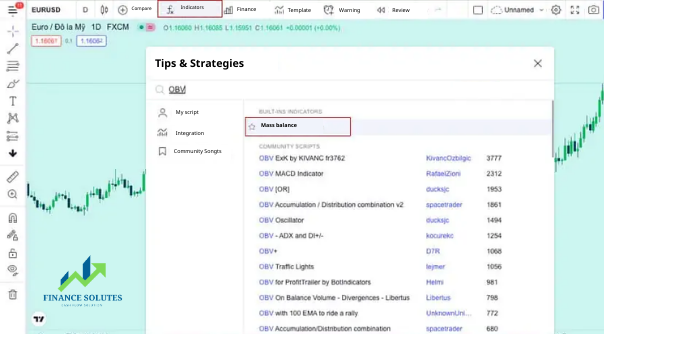
In addition, the TradingView volume indicator (OBV) is already integrated, and traders can open the OBV indicator by following these steps:
Open the chart for the currency pair you want to analyze -> Select “Indicators” -> Type “OBV” in the search box -> Select “On Balance Volume”.
In MT4, like other indicators, you can go to Insert -> Indicators -> Choose Volumes -> Select On Balance Volume (see the guide below).
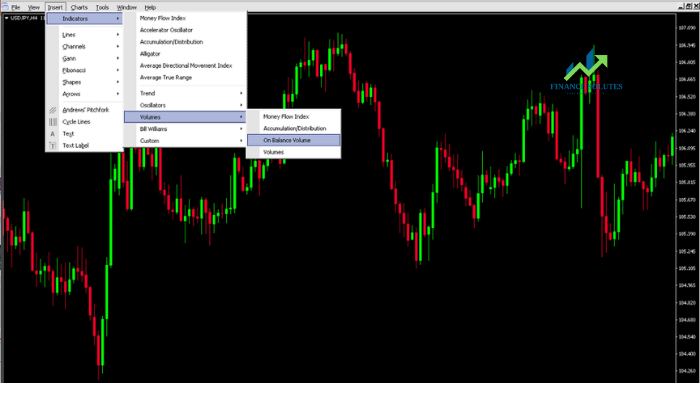
After that, a settings window for the OBV indicator will appear, where traders can customize the color, display style, and other preferences.
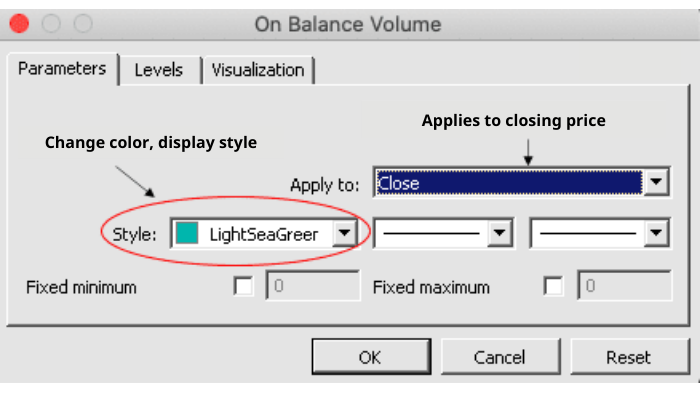
If you do not want to make any changes or have finished adjusting, click OK. The OBV indicator will then appear below the chart.
3. ADVANCED OBV INDICATOR – HOW TO USE OBV INDICATOR
You can see the value of the OBV line, but your main focus should be on the direction of the OBV line. It can tell you whether there is buying or selling pressure in the market.
3.1. Indicator Confirms Trend
Traders use the OBV indicator in their trading strategies to forecast price movements or when they want to confirm a trend.
Some notes on how to use the OBV indicator include:
- When both the price and the OBV line are making higher highs and higher lows, an uptrend is likely to continue.
- Conversely, when both the OBV indicator and the price are making lower highs and lower lows, a downtrend is likely to continue.
- When the price is in a trading range, if the OBV indicator is rising, it could signal a breakout to the upside, and vice versa.
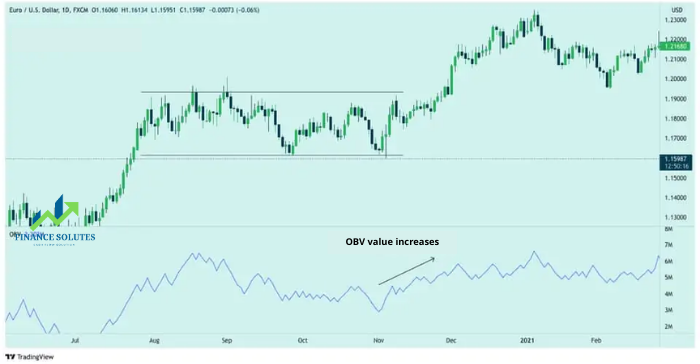
If the OBV indicator is moving noticeably in one direction, it can provide confidence to the idea that a significant price movement may follow in that direction.
Let’s take a look at the GBP/USD chart example below. In the circled area, you can see the OBV indicator dropping faster and deeper than the corresponding price candles. This could alert traders that a strong decline may be imminent.
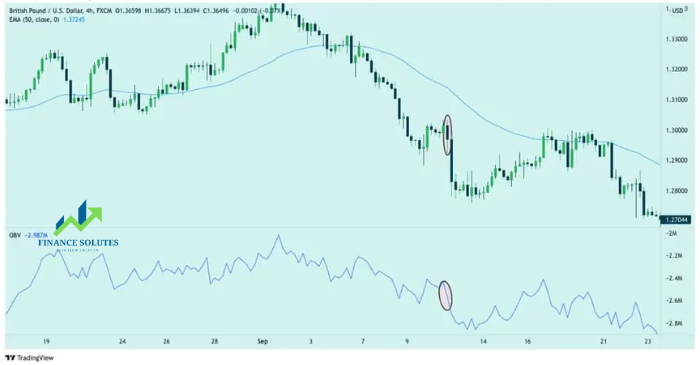
For traders who want to stay in line with the trend, they can combine the OBV indicator with a trend tool, such as the 50 EMA indicator in this example.
3.2. Divergence Signals from the OBV Indicator
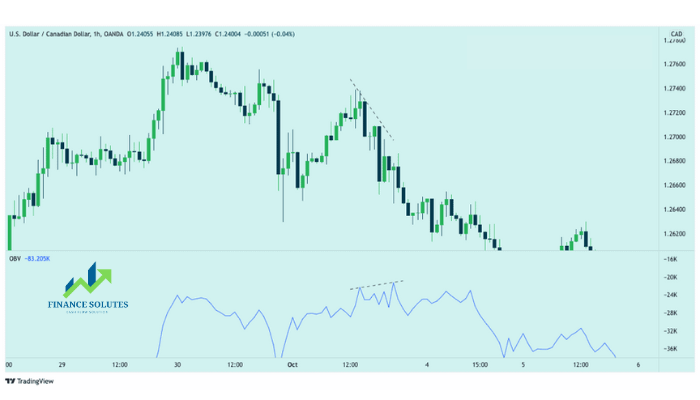
Additionally, traders should watch for divergence signals from the OBV indicator.
- When the price continues to make higher highs, but the OBV line fails to make higher highs, the uptrend could be weakening or about to reverse.
- Conversely, when the price continues to make lower lows, but the OBV indicator fails to make lower lows, it may indicate that the price is about to reverse or the downtrend could be weakening.
4. ADVANTAGES AND LIMITATIONS OF THE OBV INDICATOR
| Advantages | Limitations |
| – Easy to calculate – OBV provides potential breakout signals when the market is sideways– Can be used as a trend confirmation indicator |
– Can generate false signals because it is a leading indicator (should be combined with a lagging indicator) – Caution is needed when sudden volume spikes could cause OBV to decline for an extended period.– OBV Indicator does not account for price volatility |
5. CONCLUSION
The OBV indicator is a technical tool that is relatively easy to use. Traders can apply this indicator in both trending and sideways markets. The fact that the indicator uses volume to forecast smart money flows is similar to the accumulation/distribution indicator.
However, these two indicators are entirely different. The formula for calculating the accumulation/distribution indicator uses the current price position relative to the recent trading range and multiplies it by the volume during that period.
While its effectiveness is undeniable, this volume-based indicator has its limitations that traders need to be aware of. To mitigate some of the limitations of the OBV indicator, traders can combine it with other technical indicators or tools.
We hope this article has helped you understand what On Balance Volume (OBV) is and how to use the OBV indicator. Don’t forget to follow other articles on the Finance Solutes page!
- t.me/finance_solutes
- Website: https://finance-solutes.com
- Hotline: +1 929 5636 439 ( Hotline )
- 26 Broadway, Suite 934, New York, 10004, US
