
 XM
XM Bybit
Bybit Binance
 Robinhood
 Webull
 IC Markets
 Pepperstone
 OKX
OKX Vantage
 VT Markets
 BingX
BingX Gate.io
 Kucoin
 MEXC
MEXC Exness
 Bitget
Aroon Indicator – a uniquely significant indicator created in 1995. In today’s article, we will take a closer look at this indicator, including what the Aroon Indicator is, how to use the Aroon Indicator, how to install the Aroon Indicator on MT4, and how to use the Aroon Indicator on TradingView. In addition, we will also explore its sibling – the Aroon Oscillator.
1. WHAT IS THE AROON INDICATOR?
The Aroon Indicator is one of the momentum indicators developed in 1995 by Tushar Chande. In Sanskrit, Aroon means “the light of dawn,” as Chande felt it was a perfect description for an oscillating indicator. The name was chosen because the Aroon Indicator is designed to help traders determine whether a new trend has begun.
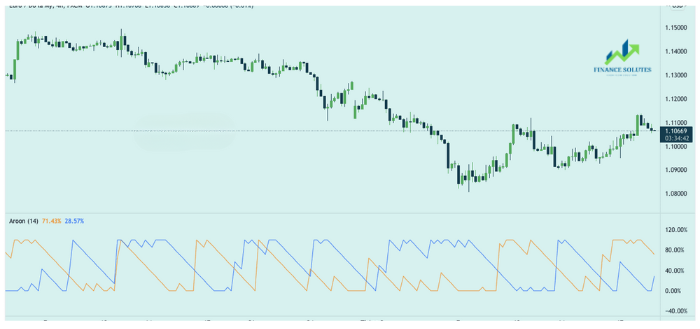
The Aroon Indicator appears as two fluctuating lines below the price chart, moving within a range from 0 to 100 (%). These two lines are called Aroon Up and Aroon Down. By observing the shape and movement of these lines, traders can assess whether the market is trending or not.
1.1. How to Calculate the Aroon Indicator
The Aroon Up and Aroon Down lines measure the number of periods since the price recorded its highest or lowest point. As the names suggest, the Aroon Up line is calculated based on the highest prices, while the Aroon Down line measures the number of periods since the lowest price occurred. The general formula for calculating the Aroon Indicator over n periods (days) is:
Aroon Oscillator Indicator = Aroon Up – Aroon Down
Where:
– Aroon Up = 100 × (n – number of days since the highest high in n days) / n
– Aroon Down = 100 × (n – number of days since the lowest low in n days) / n
Depending on the charting platform, the default setting for the period n may vary. For example, both Aroon Indicator on TradingView and Aroon Indicator on MT4 are typically set to a default of 14 periods. However, you can freely customize and adjust this parameter to suit your trading strategy.
1.2. The Aroon Oscillator
In English-language materials, the Aroon Indicator is sometimes referred to as the Aroon Momentum Oscillator because it belongs to the group of oscillators. However, the Aroon Indicator and the Aroon Oscillator are not the same. The Aroon Oscillator is considered a variant derived from the original Aroon Indicator.
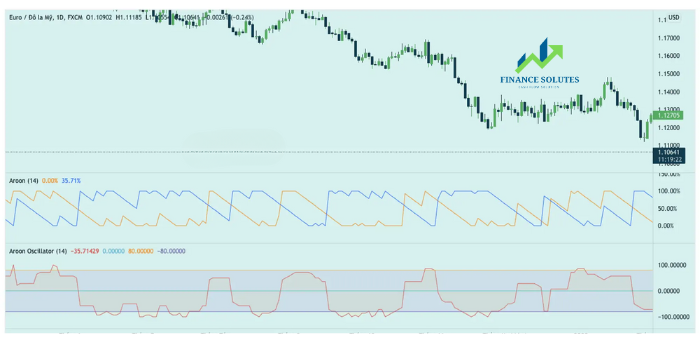
Instead of displaying two separate lines like Aroon Up and Aroon Down in the original Aroon Indicator, the Aroon Oscillator combines them into a single line. This line oscillates around a central zero line.
When the oscillator rises above +50, it signals strong bullish momentum. Conversely, when it drops below -50, it indicates a strong bearish move.
2. HOW TO INSTALL THE AROON INDICATOR
Currently, the two most commonly used platforms by traders are MT4 (MetaTrader 4) and the online charting platform TradingView. This section will guide you through installing the Aroon Indicator on both platforms.
2.1. How to Install Aroon Indicator on MT4
First, note that the Aroon Indicator is not included by default in the MT4 platform — you’ll need to download and install it manually. You can download the Aroon Indicator completely for free HERE.
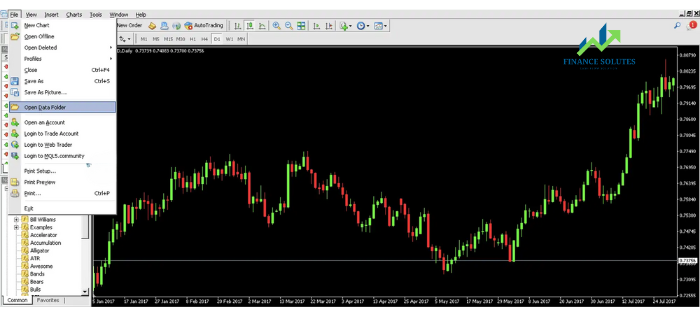
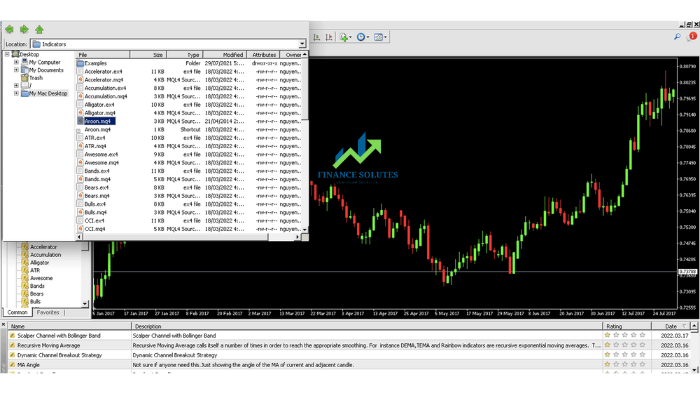
Once downloaded, open your MT4 platform and go to: File → Open Data Folder.
Note: When downloading the Aroon Indicator for MT4, it’s recommended to save the file to your desktop for easier access.
After opening the Open Data Folder, locate the file you downloaded and extract (unzip) it. Then, copy the extracted file.
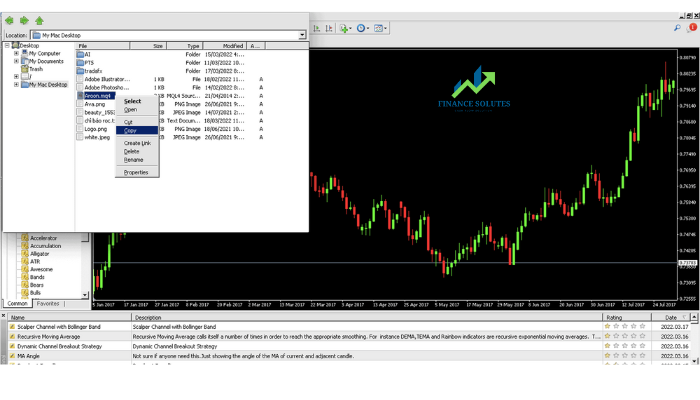
Next, go back to the MQL4 folder → open the Indicators folder, then paste the file you just copied into this directory.
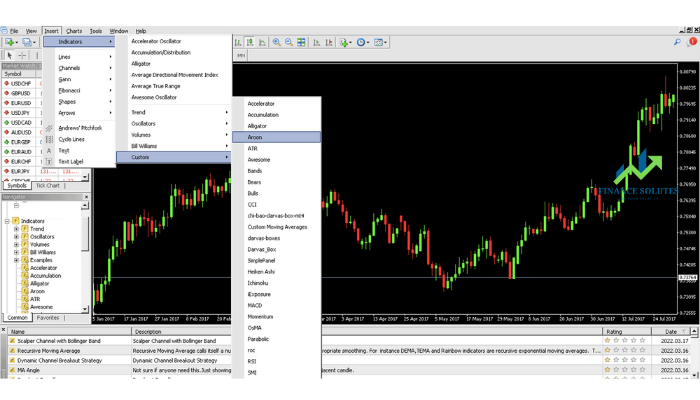
After that, go to Insert → Indicators → Custom → Select Aroon. If you still don’t see the Aroon Indicator even after successfully installing it, simply close MT4 and restart it — the indicator should then appear.
2.2. How to Open the Aroon Indicator on TradingView
Unlike MT4, the Aroon Indicator is built-in on TradingView. For those already familiar with TradingView, opening indicators is likely second nature. However, this guide is specifically for traders who are new to the platform.
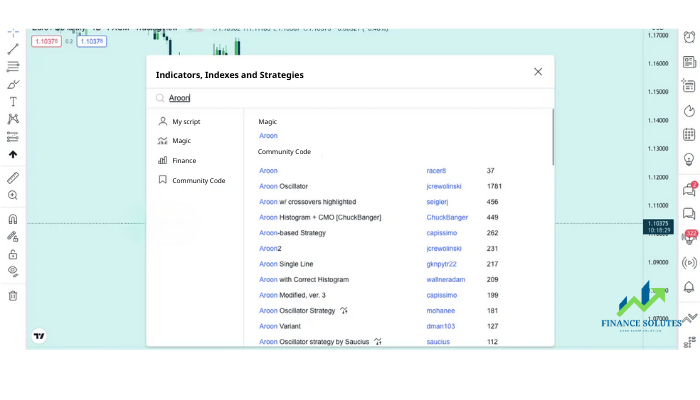
First, open the chart of the currency pair (or asset) you want to analyze. Then, on the top menu bar, click on “Indicators”. Once the search box appears, type “Aroon” into the search field. The system will display Aroon Indicator suggestions — simply select it under the “Technical” section.
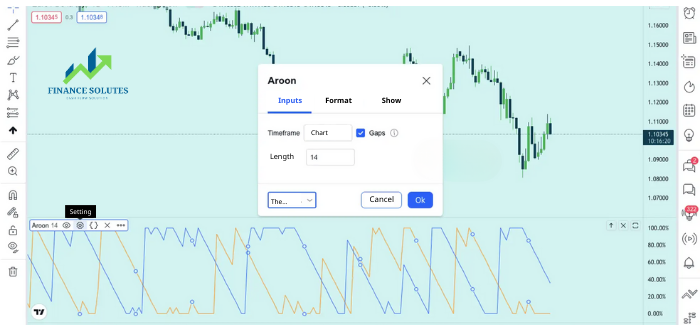
Here, you can fully customize the Aroon Indicator — such as changing the line colors, calculation period, and more — by clicking on the gear icon next to the indicator’s name.
3. HOW TO USE THE AROON INDICATOR
As mentioned in previous sections, the Aroon Indicator basically helps you monitor and analyze the timing of when prices reach their highest highs and lowest lows. From this, it can provide signals about market trends. Let’s dive deeper into how to interpret and analyze these signals.
3.1. Using the Aroon Indicator to Identify Trends
When a new trend signal is about to appear, it is usually divided into three stages: Aroon Up crosses above Aroon Down for an uptrend signal. Next, Aroon Up crosses above 50, Aroon Down moves below 50. The final stage is Aroon Up reaching 100 while Aroon Down is at around 30 or lower. The opposite is true for a downtrend. When both Aroon lines are below 50, it is a period of consolidation with no clear trend.
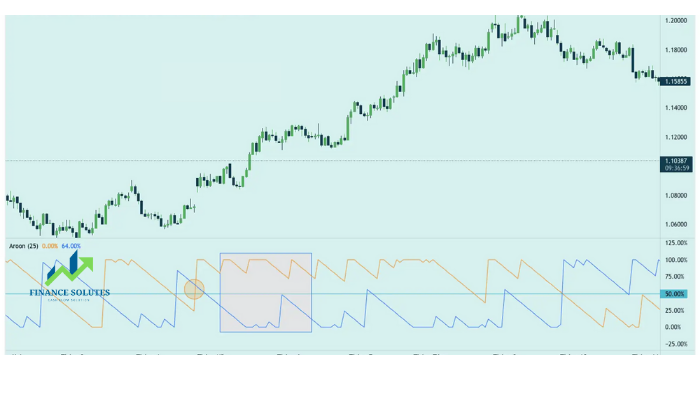
Note: The order of these signals in the three stages may vary.
3.2. Aroon Up and Aroon Down Crossover Strategy
Additionally, traders can receive trading signals from the crossover of the two Aroon lines. When this crossover occurs, it often signals a trend change or market reversal.
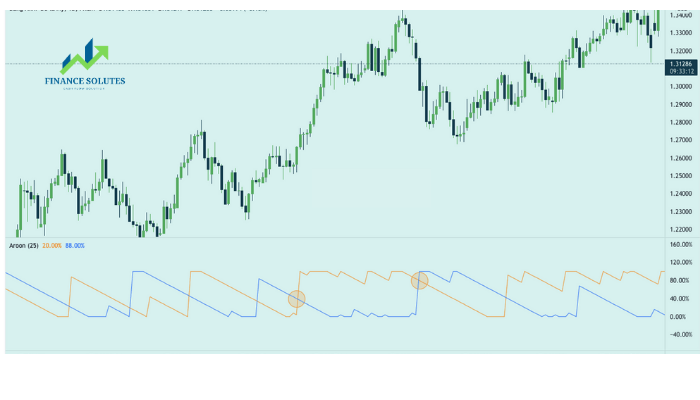
Basically, the key is to observe whether the Aroon Up line crosses below the Aroon Down line or vice versa. However, like most momentum oscillators, the Aroon Indicator can produce false signals during volatile and unstable market conditions. Therefore, wise traders seek confirmation from price action and volume rather than relying solely on the Aroon Indicator.
4. SUMMARY
In today’s article about What is the Aroon Indicator, traders have gained an understanding of the meaning behind the Aroon Indicator and learned how to use it effectively.
Additionally, it’s important to recognize that this technical analysis tool should not be overestimated — it is best used in combination with other indicators to confirm signals rather than used alone for making trading decisions.
- t.me/finance_solutes
- Website: https://finance-solutes.com
- Hotline: +1 929 5636 439 ( Hotline )
- 26 Broadway, Suite 934, New York, 10004, US
