
 XM
XM Bybit
Bybit Binance
 Robinhood
 Webull
 IC Markets
 Pepperstone
 OKX
OKX Vantage
 VT Markets
 BingX
BingX Gate.io
 Kucoin
 MEXC
MEXC Exness
 Bitget
Before participating in any financial market transaction—from stocks, forex to cryptocurrency—you should get familiar with the different types of markets.
Normally, people mainly talk about bear markets and bull markets, which indicate downward and upward price trends. However, in this article, Finance Solutes will introduce you to the sideways market, a type of market that commonly appears most of the time.
So, what is a sideways market? What are the signs to recognize a sideways market? Are there any trading strategies to make money in a sideways market?
1. WHAT IS A SIDEWAYS MARKET?
So, what is a sideways market? Simply put, it refers to a situation where the price of an asset fluctuates within a narrow range, showing no clear upward or downward trend.
In other words, a sideways market is characterized by horizontal price movement, which occurs when supply and demand are relatively balanced. It often indicates a period of price consolidation before the market either continues a previous trend or reverses into a new one.
A sideways market forms through price oscillations between strong support and resistance levels. As a result, price volatility remains limited for an extended period before a new trend—either bullish or bearish—emerges.
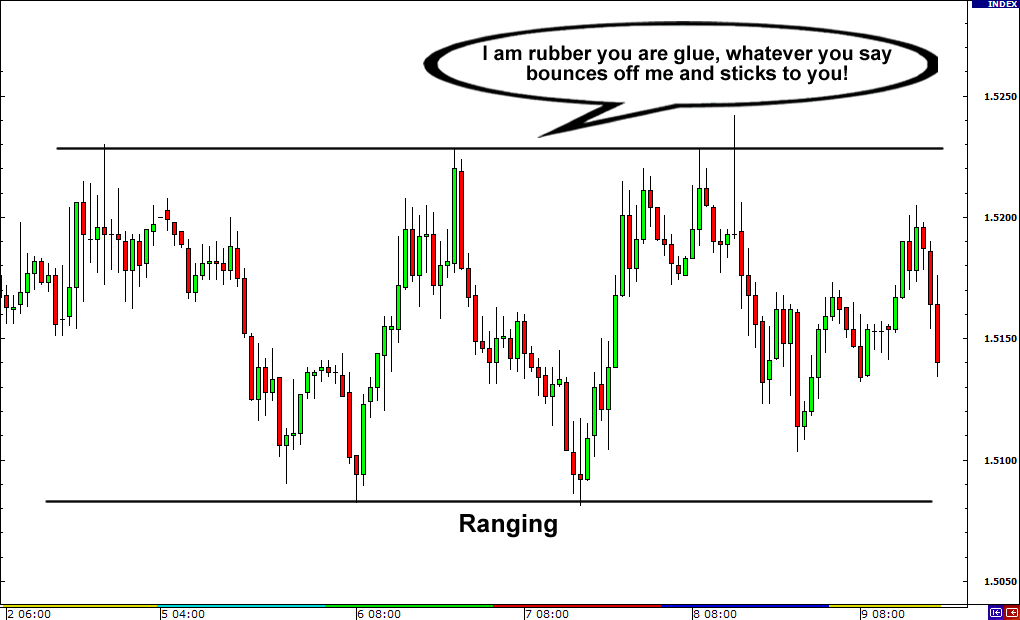
On the other hand, volume—a key indicator of trading—typically remains unchanged throughout a sideways market because neither the upward nor downward trend dominates. When a breakout occurs, both volume and price can quickly surge or even fall into a freefall.
This is why traders must pay close attention to technical indicators and other visual patterns when analyzing a sideways market. The goal is to determine how the price will change and when a breakout might occur.
2. WHAT ARE THE SIGNS OF A SIDEWAYS MARKET?
To know how to trade a sideways market—or even to determine whether you should trade or avoid the market—you first need to identify it. Below are some key things to watch for if you want to recognize a sideways market.
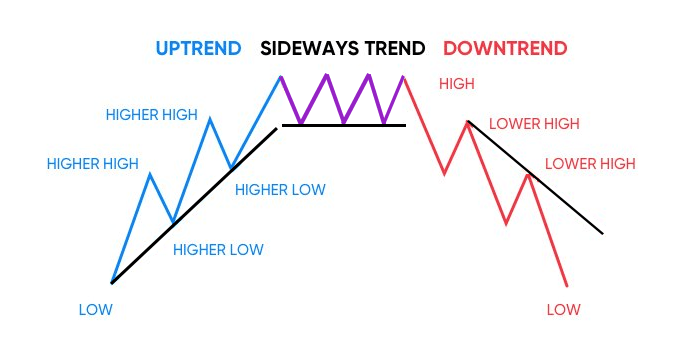
The first step is to identify support and resistance levels. A support level is the price point where buyers return to purchase the asset—where the price seems unable to drop below. On the other hand, a resistance level is where previous buyers sell off because the price is believed to be unable to rise any higher. This is also the price zone where sellers place their sell orders.
You can recognize these value zones by observing the price repeatedly bouncing back when approaching these areas. Support acts like a price floor, while resistance acts like a price ceiling. When you see the price bound within the limits set by these two levels, the market is moving sideways.
As the price continues to move within those levels, there may come a time when it breaks out of one of the boundaries. In most cases, the price is still considered sideways even if it creates slightly higher highs or lower lows within the range. In other words, you can view support or resistance as price zones rather than straight lines.
Eventually, the price will break out, followed by a rise to a higher high or a fall to a lower low, signaling the end of the sideways market and marking the beginning of a new uptrend or downtrend. However, there may be several false breakouts before a real breakout occurs.
3. THE DIFFERENCE BETWEEN A SIDEWAYS MARKET AND A TRENDING MARKET
The sideways market, bull market, and bear market are three contrasting market conditions.
Below is a brief guide to these three market conditions:
-
In a bull market, prices are trending upward. This is often the result of increased demand for an asset along with reduced supply.
-
A bear market shows the opposite. The market is bearish when prices seem to be steadily declining, often due to decreased demand for the asset.
-
Meanwhile, a sideways market shows that an asset’s price is neither rising nor falling. This usually happens when there are both bullish and bearish movements, leading to consistent price fluctuations.
4. WHAT ARE THE ADVANTAGES AND DISADVANTAGES OF A SIDEWAYS MARKET?
There are several pros and cons to trading in a sideways market.
4.1. Advantages
-
Clear entry and exit levels: Sideways markets often have clearly defined support and resistance levels, so traders know where to look for trading setups. A hammer candlestick pattern at support can be a strong signal to buy, with a profit target placed before resistance.
-
Tight risk control: When trading a sideways market, traders must exercise extra caution. They set stop-loss orders to minimize the downside risk of a trade.
4.2. Disadvantages
-
Increased trading costs due to frequent trades: This type of trading typically offers more opportunities than trend-following strategies. With more frequent trading, the costs in terms of spreads and commissions tend to be higher.
-
Requires more screen time: More trading means spending more time in front of the screen analyzing the market, placing trades, and monitoring them.
5. TIPS FOR TRADING A SIDEWAYS MARKET
A simple truth is that the market is mostly in a sideways or non-trending state. It is within these sideways conditions that traders are most likely to do harm to themselves.
5.1. Determine whether the market is worth trading
A sideways market can be worth trading if it is range-bound, meaning it is trading or oscillating between clearly defined horizontal support and resistance levels with a decent distance between them.
To determine whether a market is worth trading, first zoom out the chart and get a broader perspective using the daily time frame. Is the market trending clearly upward or downward? If not, it is likely moving sideways.
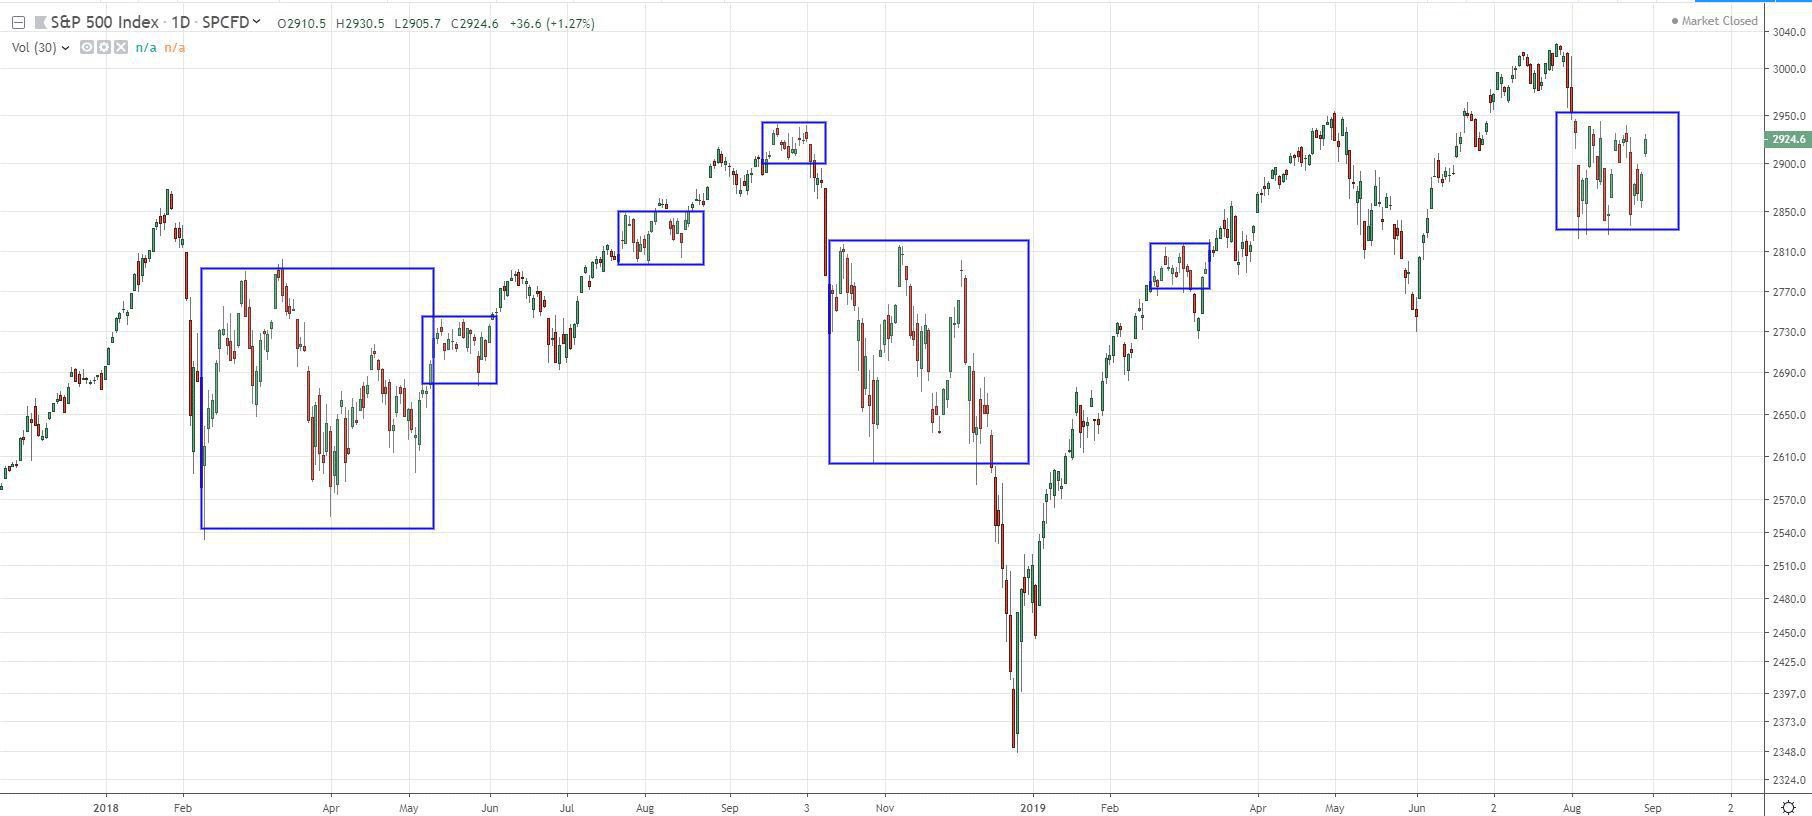
If it is sideways, then you need to determine whether it is in a tradable range or just randomly moving sideways. A range-bound sideways market, and thus worth trading, looks like this…
5.2. Avoid trading when the market is ‘choppy’
A choppy market is one that is consolidating tightly. It’s not worth trading because the range between reversals is too small to allow for a favorable risk-reward (RR) ratio.
The best way to identify whether a market is choppy is to zoom out the daily chart and observe the broader picture. With practice, you’ll be able to easily recognize whether the market is range-bound or simply fluctuating without direction.
5.3. What to Do When a Sideways Market is Worth Trading
Traders can watch for price action buy and sell signals at the support and resistance levels of the range. Perhaps the best way to trade a range-bound market is by using a false breakout strategy. By waiting for the market to make a false breakout within the trading range, you significantly increase your chances of making a profit.
In almost every trading range, there is at least one false breakout, and these often lead to strong moves in the opposite direction—back toward the other side of the range.
Most people will try to trade the breakout of a range and lose a lot of money doing so. You can take advantage of this common crowd behavior by using a contrarian approach: trade the range by looking for false breakouts.
5.4. Don’t rush into a trade
Finally, if the market is choppy and not within a clearly defined trading range, then don’t trade. Sitting on the sidelines and preserving your trading capital is always a better option than overtrading and losing money just because you couldn’t resist the urge to enter the market.
6. SUMMARY
This article has summarized the key points around: What is a sideways market? How to identify one? Are there any strategies to profit in sideways conditions?
Although there may be brief periods of volatility within a sideways market, most of these moves tend to be short-term and don’t necessarily impact long-term profitability.
However, if investors can maintain their discipline—staying agile with both their investment decisions and mindset—when trading in a sideways market, it can lead to substantial profits over time.
- t.me/finance_solutes
- Website: https://finance-solutes.com
- Hotline: +1 929 5636 439 ( Hotline )
- 26 Broadway, Suite 934, New York, 10004, US
