
 XM
XM Bybit
Bybit Binance
 Robinhood
 Webull
 IC Markets
 Pepperstone
 OKX
OKX Vantage
 VT Markets
 BingX
BingX Gate.io
 Kucoin
 MEXC
MEXC Exness
 Bitget
Bull trap or bullish price trap may be very familiar to most traders who have lost money because of them. Identifying a bull trap to avoid losses is not easy for the majority of traders; however, there are some trading tips that can help you recognize the warning signs in advance.
Follow this article with Finance Solutes to learn the definition of Bull Trap and how to avoid falling into a bull trap when trading.
1. WHAT IS A BULL TRAP?
Have you ever suffered trading losses because of a bull trap? So, what exactly is a bull trap?
A bull trap is a setup that deceives some traders into thinking that a market or a specific stock price has bottomed out and that it’s a good time to buy. However, it turns out not to be a good time at all, as the price soon resumes its downward movement, trapping the buyers and causing them to lose money. In many ways, it’s the opposite of a bear trap, which can trick traders into selling too early during a rising market.
2. EXAMPLE OF A BULL TRAP
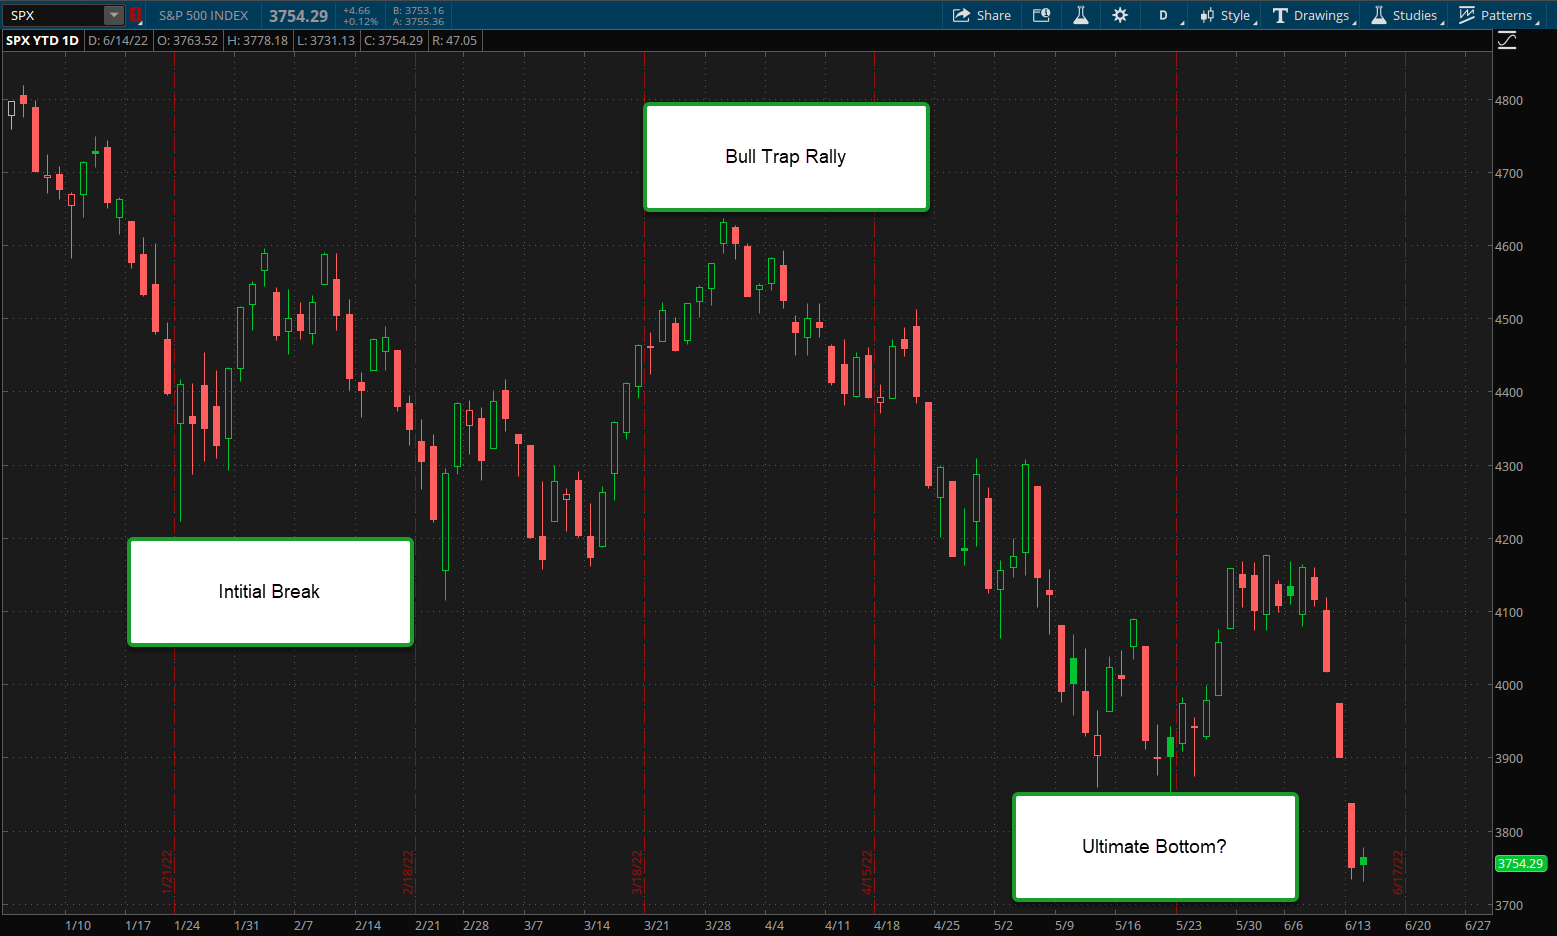
Understanding how a bull trap and bear trap work became especially necessary on June 14, 2022, when the S&P 500 Index (SPX) slipped into its first bear market since March 2020—the month COVID-19 lockdowns began.
Bear markets and broad sell-offs are often followed by sharp, convincing rallies. So how—and when—can investors tell whether a price movement is real and sustainable, or just an illusion?
The S&P 500’s (SPX) fall from its all-time high in January 2022 shows investors experienced a bull trap. Before the first sharp drop in early January 2022, the SPX was at 4,800. Despite significant volatility along the way, the index managed to rebound from around 4,100 in late February to about 4,650 in early April.
During this timeframe, that high turned out to be the end of the rally. Due to rising geopolitical tensions and inflation concerns, bullish buyers experienced a nearly 20% decline into bear territory by mid-June 2022, where even more volatility unfolded—as shown in the chart below.
3. WHAT CAUSES A BULL TRAP TO FORM?
A bull trap can occur after a market downturn when it appears the market has reached exhaustion. In the context of a sharp decline, investors often look to buy at what seems like a bargain or a bottom price.
These initial buying efforts can drive prices up to certain value zones, and these “breakouts” may trigger even more buying. However, such breakouts can actually be false signals, and prices soon resume their downward trend.
Psychology also plays a role when those buyers realize no additional buyers are coming in after them. When more sellers step in, the traders who just bought in may panic and sell as well, causing the price to fall further.
Price action is simply the result of people buying and selling. While some of these actions are based on well-researched strategies, statistics, and experience, price action can also result from people trading based on fear of missing out (FOMO), greed, anxiety, and other emotions.
4. HOW DOES A BULL TRAP WORK?
A bull trap can happen when an asset’s price breaks above a resistance level, attracting more buyers who are chasing the upward breakout. However, this buying momentum tends to be short-lived, and the price may quickly drop afterward. It’s called a trap because buyers who enter at the breakout to a new high may be forced to exit or face mounting losses as the price reverses and declines.
While bull traps can cause some traders to lose money, they can be profitable for those who understand how they work.
Bull traps typically occur during downtrends or bear markets, when a price starts to rise. Buyers might misinterpret this increase as the end of the downtrend. A technical signal—such as price moving above resistance—can boost their confidence. However, they are quickly overwhelmed by sellers as the downtrend continues rather than reverses.
Although bull traps are often associated with short-term price increases during a downtrend, they can also occur in range-bound markets or near the end of an uptrend.
In sideways markets, prices may occasionally attempt to break higher, surpassing previous highs within the range. If there aren’t enough buyers to sustain the rally, the price may fall back into the range, trapping recent buyers in losing positions.
The same can happen at the end of an uptrend. As the number of buyers decreases, the price may slightly exceed the previous high—forming a trap—only to drop sharply afterward as sellers gain control.
Bull traps can occur in any financial market, including stocks, indices, or forex trading.
5. WHAT ARE THE SIGNS OF A BULL TRAP?
Identifying a bull trap can be easier if a trader knows what to look for. Here are some common signs that a bull trap may be forming:
5.1. Price consistently reacts to a resistance level
The first clue of an impending bull trap is a strong uptrend that has been sustained for a significant period but is repeatedly reacting to a specific resistance zone.
A strong uptrend with minimal bearish interruption suggests that buyers are throwing everything into the market. However, when they push the price up to a certain resistance level, hesitation or fear may set in—and the price turns back before breaking higher.
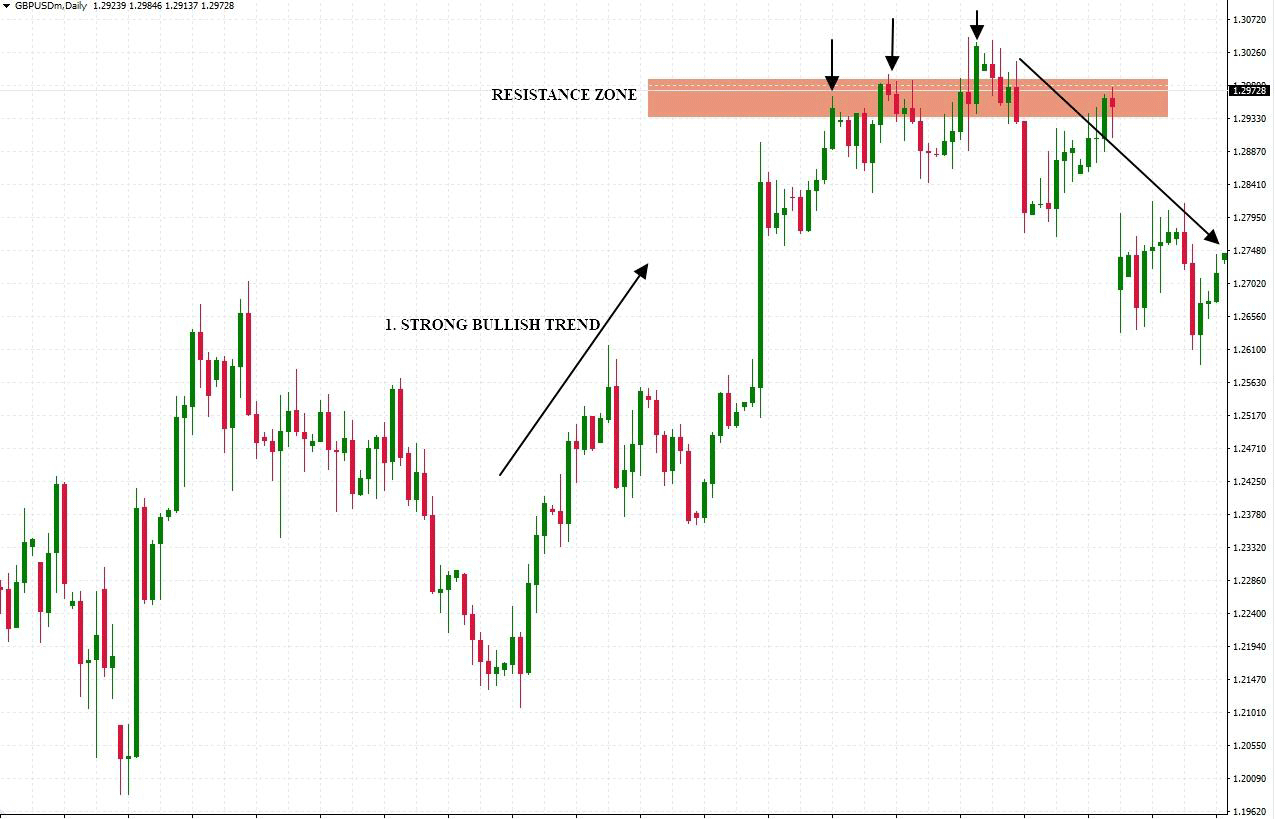
However, after the price touches the marked resistance level, it slows down and pulls back slightly before pushing higher. As we can see, there were three tests of this level before the final bull trap occurred.
5.2. Unusually Large Bullish Candle
In the final stage of the trap, there is often a very large bullish candle that dominates most of the previous candle bodies. There can be several explanations behind this candlestick pattern:
-
First, new buyers believe a breakout has occurred and they start buying in.
-
Second, some “whales” may be deliberately pushing the price higher to attract unsuspecting buyers.
-
Third, the sellers have used a tactic to allow buyers to temporarily dominate the market and trigger a series of sell limit orders above the resistance zone.
5.3. Formation of a Price Range
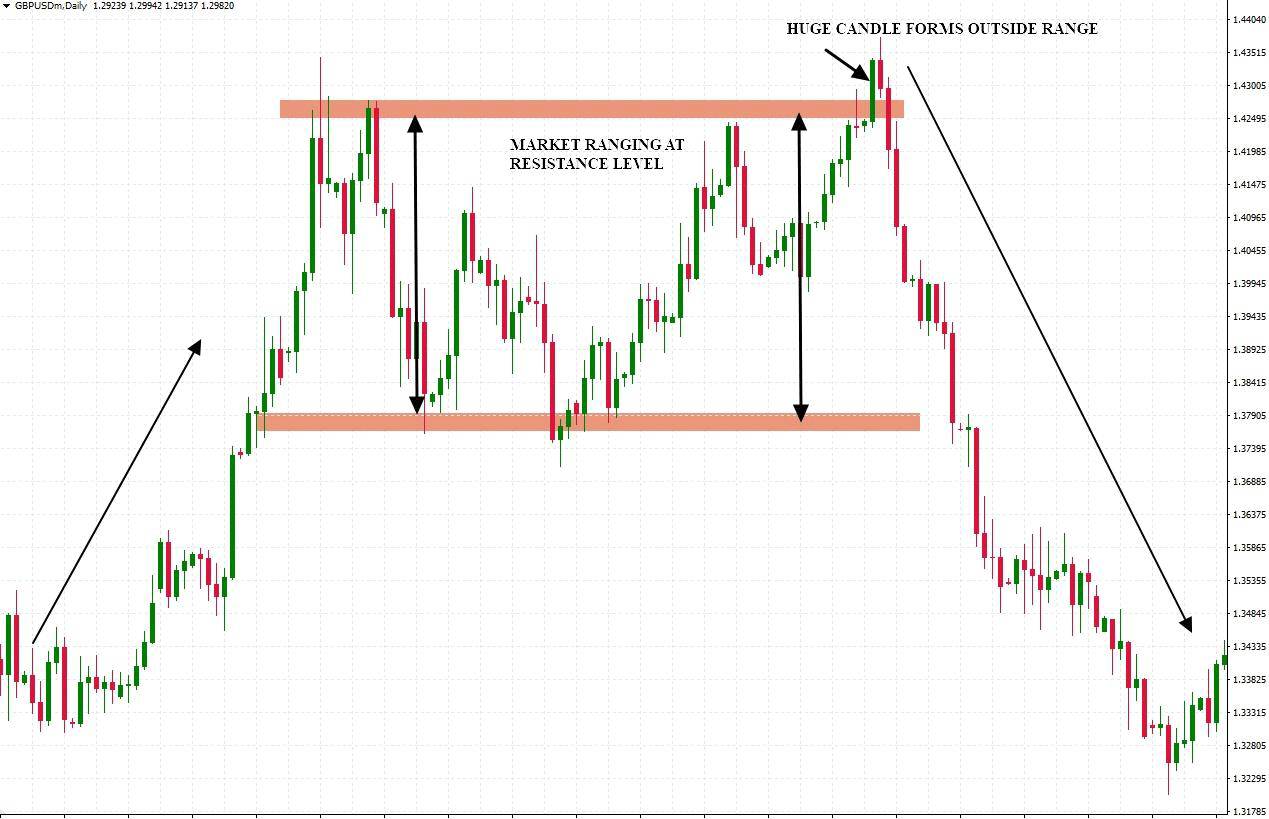
The final characteristic of a bull trap formation is that it creates a range-like pattern just above the resistance level.
A range means the price appears to bounce back and forth within a support and resistance zone. This range may not be perfect, especially on the upper side, because the market may still be making slightly higher highs.
It’s easy to identify the beginning of a bull trap because the large candle discussed above forms and closes outside this range.
Take a look at the following image and observe how the range forms before the bull trap.
6. HOW TO TRADE A BULL TRAP
Method #1: Buy at the Retest Zone
If you need to buy at a resistance level, wait for the price to drop for a retest and then open a buy order. Such signals can be further confirmed using other methods such as candlestick patterns or indicators.
For example: if after retesting this zone, a bullish engulfing pattern forms, you may consider buying in.
Method #2: Sell After a Successful Trend Reversal
The safest way to trade a bull trap is to accept that the trend has changed and follow the new direction.
Method #3: Use a Stop-loss
The best way to escape a bull trap is to place a stop-loss order on your position from the beginning. This helps prevent significant losses if you fall into a bull trap.
There are several types of stop-losses to choose from. When trying to avoid a bull trap, a trailing stop may be the most helpful, as it follows the current market value by a set number of points and automatically closes your position if the market moves against you by that amount.
7. SUMMARY
In this article, we have explored what a bull trap is, how bull traps can be identified, and even how to trade them while minimizing risk and maximizing profit. Bull trap patterns are known to lure traders into risky trades that almost always result in losses. However, by understanding how bull traps form and what they signify, they can become profitable trading setups.
- t.me/finance_solutes
- Website: https://finance-solutes.com
- Hotline: +1 929 5636 439 ( Hotline )
- 26 Broadway, Suite 934, New York, 10004, US
