
 XM
XM Bybit
Bybit Binance
 Robinhood
 Webull
 IC Markets
 Pepperstone
 OKX
OKX Vantage
 VT Markets
 BingX
BingX Gate.io
 Kucoin
 MEXC
MEXC Exness
 Bitget
OBV (On Balance Volume) is a volume indicator that measures the momentum of a trend based on the correlation between price movement and trading volume. Although it is not as popular as other indicators, to succeed in financial trading, you absolutely should not overlook this indicator. So, what exactly is OBV? How do you use the OBV indicator in the financial markets?
1. What is the OBV indicator?
OBV stands for “On-Balance Volume,” a technical indicator used in the field of technical stock analysis. The OBV indicator is used to measure buying and selling pressure in the stock market and helps investors and traders identify trends and potential reversals in stock prices.
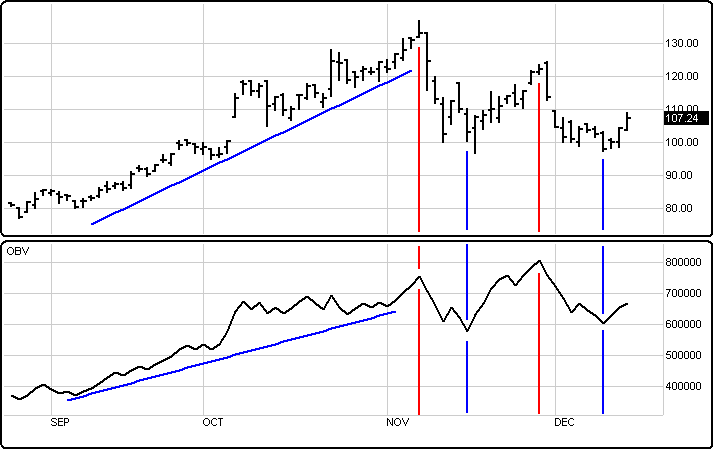
The OBV indicator is derived from changes in trading volume and stock prices. Specifically, if the stock price rises during a trading session, the OBV value will increase accordingly, and if the stock price falls, the OBV value will decrease. OBV accumulates the cumulative volume values across trading sessions and can help investors determine the alignment between buying/selling pressure and the stock price trend.
When OBV rises, it often indicates increasing buying pressure and can be a positive sign for the stock price trend. Conversely, when OBV falls, it may indicate increasing selling pressure and a potential downward trend reversal.
2. How to Calculate the OBV Indicator
The OBV (On-Balance Volume) indicator is a technical analysis tool used in stock trading to measure the amount of money flowing into or out of a stock or market. OBV helps traders determine buying and selling pressure over a specific period. Below is how the OBV indicator is calculated:
- When the closing price of the current trading session is higher than the closing price of the previous session, the OBV value is calculated as:
Current OBV = Previous OBV + Current Trading Volume
(If the closing price increases compared to the previous session, OBV increases)
- When the closing price of the current trading session is lower than the closing price of the previous session, the OBV value is:
Current OBV = Previous OBV – Current Trading Volume
(If the closing price decreases compared to the previous session, OBV decreases)
- When the closing price of the current session is equal to the closing price of the previous session:
Current OBV = Previous OBV
(If the closing price remains unchanged, OBV stays the same)
Example: If the previous OBV was 100 and the closing price in the current session rises compared to the previous session, with a trading volume of 10, then the current OBV will be 110.
The OBV indicator is often charted and used to analyze trends and buy/sell signals. It reflects investor participation and buying/selling pressure in the market. If OBV continues to rise over time, it may indicate a strong upward trend. Conversely, if OBV steadily declines, it may reflect a downward trend.
3. The Significance of the OBV Indicator
The OBV (On-Balance Volume) indicator plays a crucial role in technical analysis and stock trading. We can summarize the main insights provided by the OBV indicator as follows:
3.1. Identifying Price Trends
OBV helps identify price trends through the accumulation of OBV values. If OBV increases over time, it may indicate an uptrend. If OBV decreases, it may suggest a downtrend. This helps traders determine the market’s direction.
3.2. Determining Buying and Selling Pressure
OBV shows the participation of buyers and sellers in the market. Specifically:
If OBV increases significantly (i.e., the OBV line trends upward), it means the trading volume on up days is higher than that on down days, or the positive volume flow outweighs the negative volume flow. A rising OBV reflects stronger buying pressure compared to selling pressure, suggesting that prices may continue to rise.
Conversely, if OBV decreases, selling pressure may be increasing. This can help forecast future stock price movements.
3.3. Detecting Market Shifts
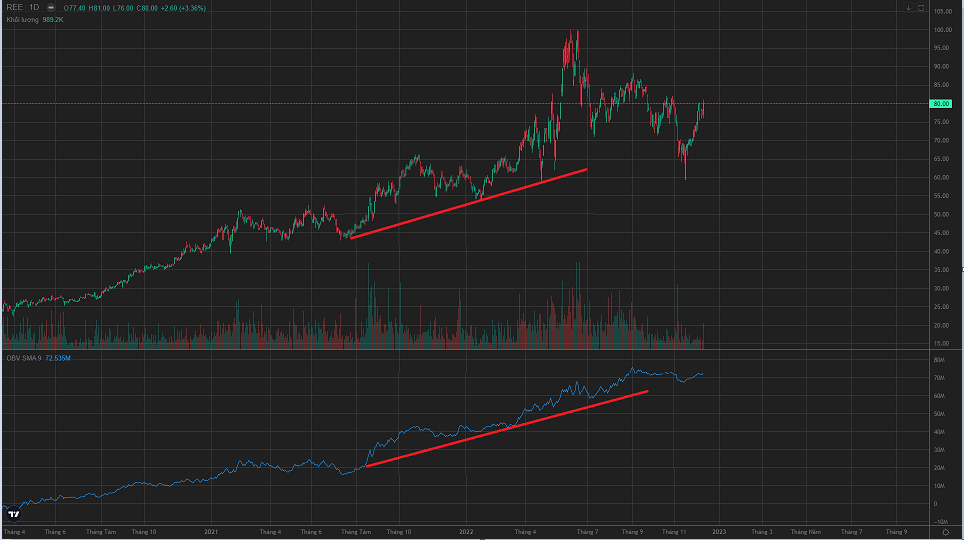
OBV can detect potential shifts in market conditions before they fully materialize. For instance, if the price of a stock forms a new high but OBV fails to do so, this may indicate weakness in the upward trend — a possible bearish signal.
3.4. Validating Other Trading Signals
OBV can be used in conjunction with other trading indicators such as moving averages or candlestick patterns to validate trading signals. When OBV confirms a trading signal, it can enhance the strength and reliability of that buy or sell signal.
3.5. Identifying Market Reversals
When both price and OBV move in the same direction, it signals trend continuation. However, when OBV diverges from price, it may suggest a weakening trend and potential reversal.
- Divergence: Occurs when prices make higher highs while OBV makes lower highs. This indicates that the upward trend is losing momentum and may reverse to the downside.
- Convergence: Happens when prices make lower lows but OBV does not follow suit. This suggests that the downward trend is weakening and may be close to reversing to the upside.
4. How to use the OBV Indicator
4.1. Trend-Following Trading
When OBV is rising and aligns with the direction of the price trend, it may indicate a strong trend. Traders may consider opening long positions (buys) to take advantage of the upward momentum.
4.2. Reversal Trading Using Divergence and Convergence
Reversal trading strategies are generally riskier than trend-following approaches. However, with careful analysis, they can yield high returns.
Trading OBV Divergence:
Divergence occurs when OBV moves in the opposite direction of price. For example:
-
If the asset’s price makes a new lower low while OBV forms a higher low, it could indicate a bullish divergence and possible trend reversal to the upside.
-
If the price makes a higher high while OBV makes a lower high, it could indicate a bearish divergence and a potential reversal to the downside.
Trading OBV Convergence:
Convergence occurs when OBV and price move in the same direction — both forming higher highs or lower lows consistently. This alignment confirms the current trend and is considered a positive sign for continuation.
5. Conclusion
The OBV indicator provides valuable insights into buying and selling pressure in the market, supporting informed trading decisions. However, like all technical tools, OBV is not infallible. It should be used with proper technical analysis skills and in combination with other indicators and market information to make more accurate and intelligent trading choices.
- t.me/finance_solutes
- Website: https://finance-solutes.com
- Hotline: +1 929 5636 439 ( Hotline )
- 26 Broadway, Suite 934, New York, 10004, US
