
 XM
XM Bybit
Bybit Binance
 Robinhood
 Webull
 IC Markets
 Pepperstone
 OKX
OKX Vantage
 VT Markets
 BingX
BingX Gate.io
 Kucoin
 MEXC
MEXC Exness
 Bitget
Welles Wilder developed the Parabolic SAR indicator in the mid-1970s. This indicator determines when you should close your position, when to open a new position in the opposite direction (SAR stands for Stop and Reverse), and helps identify take-profit levels. The indicator is similar to a moving average, but the difference lies in how it evolves—at a different rate. It was developed specifically to be applied in clearly trending markets. Therefore, in today’s article, Finance Solutes will provide you with insights into the Parabolic SAR indicator, a great tool for identifying the end of a trend.
1. What is the Parabolic SAR Indicator?
The Parabolic SAR indicator (Stop and Reverse) is a technical analysis tool commonly used in trading stocks, cryptocurrencies, and forex markets to determine the direction of price trends as well as potential market reversal points. It also helps identify overbought and oversold levels. This, in turn, helps traders find exit points from existing trends or entry points at the beginning of new trends.
The general principle behind the Parabolic SAR is to follow the trend. When the market is trending downward, it suggests opening a sell position and adjusting the stop-loss level according to the market’s trend. Conversely, when the market reverses in the opposite direction, it suggests opening a buy position and adjusting the stop-loss level in line with the new trend.
2. Characteristics of the Parabolic SAR Indicator
The Parabolic SAR (Stop and Reverse) indicator has the following key characteristics:
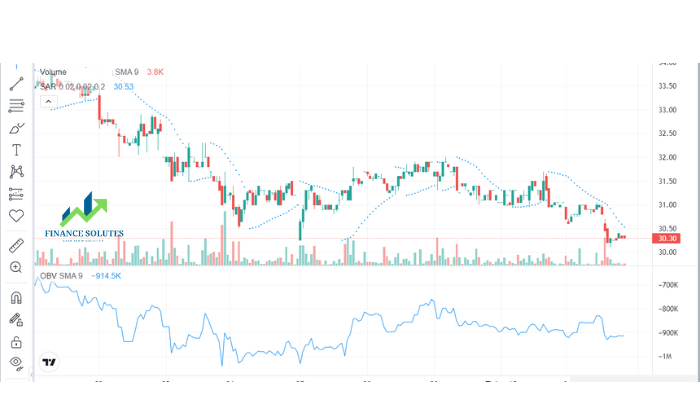
2.1. Trend Identification: The Parabolic SAR indicator is used to determine the direction of the market trend. If the SAR point is below the price, the trend is considered upward. Conversely, if the SAR point is above the price, the trend is considered downward.
2.2. Reversal Points: This indicator provides potential reversal signals when the trend changes. When the trend reverses, the SAR points will move from one side of the chart to the other. This may indicate a trend change and generate trading signals.
2.23. Automatic Stop Loss Points: The Parabolic SAR is often used to set automatic stop loss levels for trading positions. When the SAR point changes position, it can be used as a stop loss level to protect profits or minimize risk.
2.4. Increasing Acceleration: This indicator uses an acceleration factor that increases as the trend continues to develop. This helps the SAR point move deeper into the trend as the price continues to move in its direction. The acceleration can be adjusted by the user.
3. How the Parabolic SAR Works
The Parabolic SAR (Stop and Reverse) operates based on the following key elements:
3.1. Acceleration: Acceleration is an important factor in the Parabolic SAR. It is a predetermined value, typically initially set at a low level such as 0.02. This acceleration increases as the trend continues, adding to the initial acceleration value after each trading session.
3.2. Initial Point: The initial point of the Parabolic SAR is used to begin identifying the trend. This point is set below the price if the trend is up and above the price if the trend is down. It is commonly used to determine the initial reversal point.
3.3. New Calculation: After each trading session, the Parabolic SAR calculates a new point based on the data from the previous session. The calculation process is based on the following factors:
– If the trend is upward, the new Parabolic SAR point is calculated using the formula:
New Point = Previous Point + (Acceleration * (Previous High – Previous Point)).
– If the trend is downward, the new Parabolic SAR point is calculated using the formula:
New Point = Previous Point – (Acceleration * (Previous Point – Previous Low)).
3.4. Movement of the SAR Point: The SAR point, once calculated, will move based on the current session’s price data and acceleration factors. The SAR point will continue to move in the direction of the current trend and at an increasing acceleration rate.
3.5. Reversal Signal: When the SAR point moves from below the price to above (in an uptrend) or from above the price to below (in a downtrend), it generates a reversal signal. Traders often use this signal to consider closing current positions and opening new positions in the new trend direction.
4. Parabolic SAR Calculation Formula
The Parabolic SAR (Stop and Reverse) is calculated based on the acceleration factor and the initial point. Below is the formula to calculate the Parabolic SAR for a specific trading session:
4.1. Determine the Initial Point:
– The initial point of the Parabolic SAR is determined using the lowest price (for an uptrend) or the highest price (for a downtrend) of the first session in the series.
4.2. Calculate Acceleration:
– Acceleration is a predefined value, usually initially set at a low level such as 0.02. This value can be adjusted based on the trader’s preferences.
4.3. Calculate the New SAR Point:
– The new Parabolic SAR point (SARn) after each trading session is calculated based on the SAR of the previous session (SARn-1) and the current session’s price data. The formula is as follows:
4.3.1. If the trend is upward:
– SARn = SARn-1 + (Acceleration * (Previous High – SARn-1))
4.3.2. If the trend is downward:
– SARn = SARn-1 – (Acceleration * (SARn-1 – Previous Low))
– Here, SARn is the new Parabolic SAR point after the current session.
– SARn-1 is the Parabolic SAR point of the previous session.
– Previous High is the highest price of the previous session.
– Previous Low is the lowest price of the previous session.
– Acceleration is the preset acceleration value, which may gradually increase over time.
Below is a specific example of how to calculate the Parabolic SAR for a series of trading sessions. We will use an initial acceleration value of 0.02 and a sample trading session with the following price data:
– Open Price: $50
– High Price: $55
– Low Price: $48
– Close Price: $53
Step 1: Determine the Initial Point
– Since we are considering an uptrend, the initial Parabolic SAR point will be the lowest price in the first session: $48.
Step 2: Determine the Acceleration
– We set the initial acceleration at 0.02 and will keep it constant in this example.
Step 3: Calculate the New SAR Point
– Using the formula for an uptrend:
SARn = SARn-1 + (Acceleration * (Previous High – SARn-1))
SAR0 = $48 + (0.02 * ($55 – $48)) = $48 + (0.02 * $7) = $48 + $0.14 = $48.14
– The SAR point for the first session is $48.14.
Step 4: Continue calculating for subsequent sessions (repeat for each session)
– Next, we use the closing price of that session to calculate the Parabolic SAR for the next session.
SAR1 = SAR0 + (0.02 * ($53 – $48.14)) = $48.14 + (0.02 * $4.86) = $48.14 + $0.0972 = $48.2372
– The SAR point for the second session is $48.2372.
Repeat this process for each subsequent trading session to calculate the Parabolic SAR. When the Parabolic SAR moves through the price, it creates a reversal signal, and traders use it to make trading decisions.
5. Combining the Parabolic SAR with Other Indicators
5.1. Combining with Support and Resistance Levels
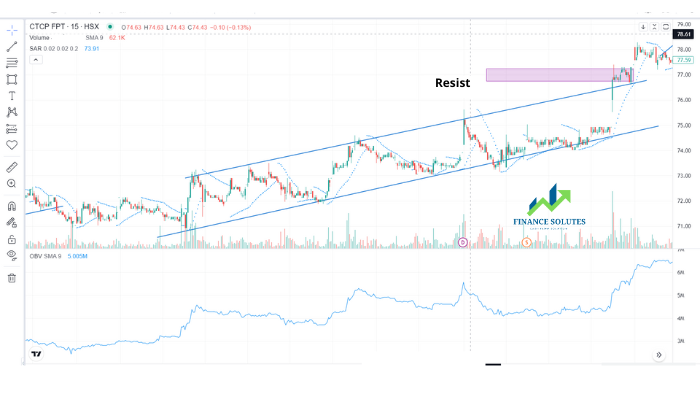
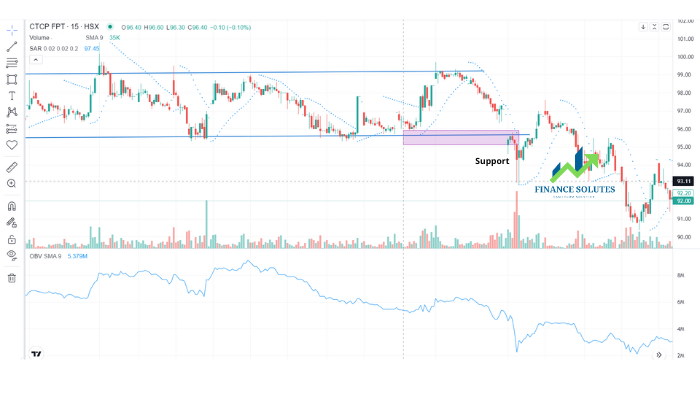
Combining the Parabolic SAR indicator with support and resistance is a common technical analysis strategy to determine entry and exit points in trading. Support and resistance are key price levels on the chart, while the Parabolic SAR helps identify trends and reversal signals. Here’s how you can combine them:
5.1.1. Identify Support and Resistance Levels:
– First, identify support and resistance levels on the chart. These are key price levels where the price often reacts or consolidates.
5.1.2. Use Parabolic SAR to Identify the Trend:
– Use the Parabolic SAR to determine the current market trend. If the SAR point is below the price, it indicates an uptrend. If the SAR point is above the price, it signals a downtrend.
5.1.3. Identify Entry and Exit Points:
– When the Parabolic SAR gives a reversal signal (when the SAR point crosses the price), you can look at support and resistance levels to identify entry or exit points.
– For example, when the Parabolic SAR moves from below the price to above (a downward reversal signal) and the price approaches a support level, it may be a selling opportunity.
5.1.4. Set Stop Loss and Profit Targets:
– Use support and resistance along with the Parabolic SAR to set stop loss and take profit levels.
– For instance, if you buy when the Parabolic SAR gives an upward reversal signal and the price approaches a resistance level, you can place a stop loss below the nearest support level and set your profit target at the resistance level.
5.2 Combining with Trendline
Combining the Parabolic SAR indicator with trendlines is a smart approach to identify market trends and entry/exit points in stock or forex trading. Here’s how you can use them:
5.2.1 Parabolic SAR (Stop and Reverse):
– Parabolic SAR is a simple yet effective indicator for identifying trends.
– It shows the stop and reverse points of a trend. If the price crosses below the Parabolic SAR, it signals a potential sell. Conversely, if the price crosses above it, it signals a potential buy.
5.2.2 Trendline:
– A trendline is a straight line drawn on the chart to represent the general direction of the price movement.
– If the price moves below the trendline, it may indicate a downtrend. Conversely, if the price moves above the trendline, it may indicate an uptrend.
When you combine both indicators, you can build a more powerful trading system. For example, if the Parabolic SAR gives a buy signal (price crosses from below to above), and the price is moving above the trendline, it could be a strong buy signal. On the other hand, if the Parabolic SAR gives a sell signal and the price is moving below the trendline, it could be a strong sell signal.
5.3 Combining with Reversal Candlestick Patterns:
5.3.1 Parabolic SAR (Stop and Reverse):
– As previously described, Parabolic SAR provides a buy signal when the price crosses from below and a sell signal when the price crosses from above.
5.3.2 Japanese Candlestick Patterns:
– Japanese candlestick patterns are time-based charts that visually represent price movements and provide insights into market sentiment.
– Common candlestick patterns include Pin Bar, Doji, Engulfing Candlestick, and many others. Each pattern has its own meaning.
When you combine both indicators, you can generate stronger trading signals. For example, if the Parabolic SAR gives a buy signal (price crosses from below) and you spot a bullish candlestick pattern like a Pin Bar or Engulfing candlestick, it may indicate a very strong buy signal.
Conversely, if the Parabolic SAR gives a sell signal (price crosses from above) and you observe a bearish candlestick pattern like a Pin Bar or Bearish Engulfing candlestick, it could be a strong sell signal.
6. Conclusion
In summary, the Parabolic SAR indicator is a useful technical analysis tool for identifying potential trend reversals in stock trading. It can provide buy/sell signals and stop-loss points for investors. However, using Parabolic SAR should be combined with other analytical tools to accurately assess market conditions. When used correctly in combination, Parabolic SAR can be highly effective and help traders achieve higher profitability.
- t.me/finance_solutes
- Website: https://finance-solutes.com
- Hotline: +1 929 5636 439 ( Hotline )
- 26 Broadway, Suite 934, New York, 10004, US
