
 XM
XM Bybit
Bybit Binance
 Robinhood
 Webull
 IC Markets
 Pepperstone
 OKX
OKX Vantage
 VT Markets
 BingX
BingX Gate.io
 Kucoin
 MEXC
MEXC Exness
 Bitget
Bollinger Bands can provide useful signals for technical traders, and when combined with Bollinger Band and MACD, it provides traders with insights into both volatility and momentum in the forex market.
1. COMBINING BOLLINGER AND MACD
As the title suggests, traders can combine Bollinger Bands and MACD to support trade setups. Bollinger Bands allow traders to assess the cyclical nature of volatility, while the MACD indicator is an effective trend momentum indicator.
Using these two indicators together can help traders execute higher probability trades as they can evaluate both the direction and strength of the current trend along with volatility. Therefore, traders can use the MACD indicator to assess whether a trend is increasing or slowing down and set up for a potential breakout trade; while Bollinger Bands can be used as an entry trigger and then confirm the trade.
2. TRADING STRATEGY WHEN COMBINING BOLLINGER BANDS AND MACD
Traders can trade with the combination of Bollinger Bands and MACD in several ways, but two of the most common ways to trade with these indicators involve trading breakouts and trend-following.
2.1. Bollinger Band Breakout Trading Strategy
Traders who want to trade the Bollinger Band breakout can consider the following steps:
- Identify a trending market using the MACD indicator
- Look for divergence in the MACD chart (indicating potential breakout)
- Look for an entry point when the price breaks the MA20 or trendline
- Look for confirmation of the breakout through the Bollinger Band breakout, along with increased volatility (Bollinger Bands expanding) and rising momentum (longer bars).
In the GBP/NZD pair chart below, a strong downtrend can be clearly seen as the price starts trading within a descending channel. Traders can trade the breakout by looking for slowing downward momentum (divergence in the MACD chart).
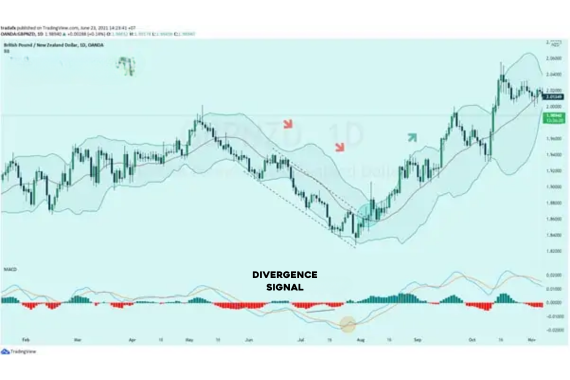
Breaking the MA20 line (the centerline of the Bollinger Bands), after witnessing a bullish divergence, provides a signal to enter a buy trade. The dotted line at the top of the channel represents resistance and coincides with the MA20 line of the Bollinger Bands when the price breaks it.
The breakout of both of these lines confirms that this is an important price level, further reinforcing the bullish trend.
The MACD indicator supports the bullish trade when the MACD line crosses above the signal line and continues to move above it, indicating strong upward momentum. Then, the Bollinger Bands confirm the bullish trend as the price begins to “walk” within increasing volatility (the expansion of the bands).
Stop-loss levels can be placed below the lower Bollinger Band or at the lowest point of the descending price channel. Take-profit levels can be set at previous key resistance levels; however, it is important to maintain a positive risk-to-reward ratio. Since a breakout trade can potentially turn into a trend reversal, traders should consider multiple take-profit levels and manually move stop-loss levels or use a trailing stop order.
2.2. Trend-Following Trading
The combination of Bollinger Bands and MACD can also be used in trending markets through the following steps:
- Identify the trend using the MACD indicator
- Use the bounces off the MA20 line as potential entry points (aligned with the trend)
- Look at the MACD indicator to confirm momentum in the direction of the trend
- Use the lower (higher) Bollinger Band as the stop-loss level in an uptrend (downtrend).
The chart of the EUR/USD pair below illustrates the trend-following strategy using Bollinger Bands and MACD. The MACD indicator confirms the bullish trend. The MACD line is above the signal line, and both lines are above the zero line. This suggests that traders should only look for buy entry points.
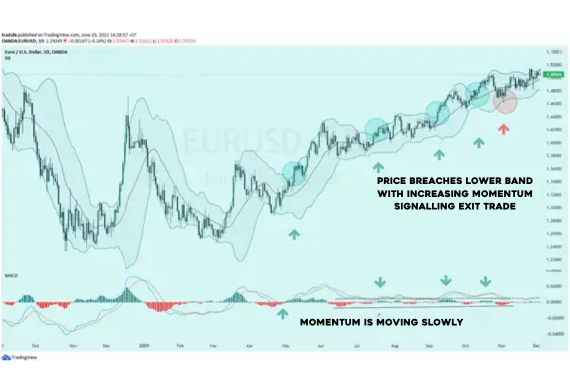
After the initial surge in momentum, the pace slows down, and although the MACD line crosses below the signal line, these movements still have low volume and result in a sideways movement in the short term rather than a reversal against the current trend.
The bullish trend is further reinforced. This is due to the fact that the price bounces off the MA20 line and continues to form higher highs and higher lows.
Traders can enter buy trades in line with the Bollinger Band Squeeze (green arrow). Buyers can choose to exit the trade when the price drops to the MA20 line, or they can wait for a breakout below the lower Bollinger Band as an exit signal.
Traders can use a manual stop-loss order or a trailing stop order along the lower Bollinger Band as the price increases. Take-profit levels can be set at important support and resistance levels; however, full risk management should still be maintained.
3. ADVANTAGES AND LIMITATIONS OF BOLLINGER BAND AND MACD
| Advantages |
|
| Limitations |
|
- t.me/finance_solutes
- Website: https://finance-solutes.com
- Hotline: +1 929 5636 439 ( Hotline )
- 26 Broadway, Suite 934, New York, 10004, US
