
 XM
XM Bybit
Bybit Binance
 Robinhood
 Webull
 IC Markets
 Pepperstone
 OKX
OKX Vantage
 VT Markets
 BingX
BingX Gate.io
 Kucoin
 MEXC
MEXC Exness
 Bitget
Bollinger Bands and MACD are two of the most commonly used indicators in the Forex market. While each of these indicators can be effective on its own, combining them enhances their power, offering traders a deeper understanding of both market volatility and momentum. Bollinger Bands provide valuable signals for technical traders, and when paired with MACD, they offer a more comprehensive view of market dynamics.
1. Combining Bollinger Bands and MACD
As the title suggests, traders can combine Bollinger Bands with MACD to support their trade setups. Bollinger Bands allow traders to assess the nature of price volatility, while MACD serves as an effective momentum indicator for trend-following strategies.
By using both indicators together, traders can increase their chances of success. This combination allows for the evaluation of both the direction and strength of the current trend, as well as market volatility. Traders can use MACD to determine if a trend is strengthening or slowing down, setting up a potential breakout trade. Meanwhile, Bollinger Bands can be used to trigger the entry and confirm the trade.
2. Trading Strategy with Bollinger Bands and MACD
Traders can use Bollinger Bands and MACD in several different ways, but two of the most common strategies involve breakout trading and trend-following.
2.1. Bollinger Band Breakout Trading Strategy
Traders interested in breakout trading with Bollinger Bands can follow these steps:
- Step 1: Identify the trend direction using the MACD indicator.
- Step 2: Look for divergence on the MACD chart (this signals a potential breakout).
- Step 3: Wait for a breakout above the MA20 or trendline.
- Step 4: Look for breakout confirmation through the Bollinger Bands, along with increased volatility (Bollinger Bands expansion) and growing momentum (longer bars on the MACD chart).
In the GBP/NZD chart below, you can clearly see a strong downtrend as the price begins to trade in a descending channel. Traders can enter a breakout trade by spotting weakening downward momentum (divergence on the MACD chart).
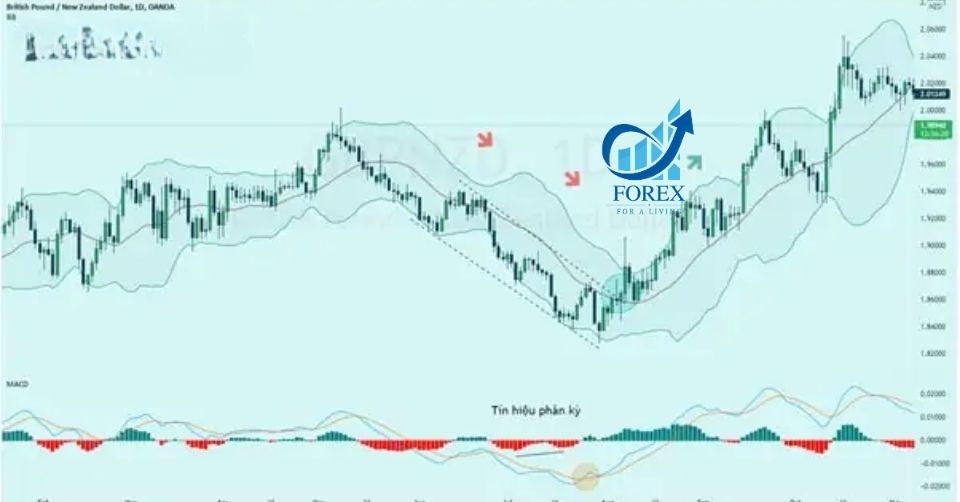
Breakout and Trend Trading Strategy with Bollinger Bands and MACD
Breaking the MA20 line (the central line in the Bollinger Bands), after witnessing an upward divergence, provides a signal to enter a buy trade. The dotted line at the top of the channel indicates resistance and coincides with the MA20 line of the Bollinger Bands when the price breaks above it.
The break of these two lines confirms that this is an important price level and reinforces the upward trend.
The MACD indicator supports the buy trade when the MACD line crosses above the signal line and continues to move above it, indicating strong bullish momentum. The Bollinger Bands then confirm the upward trend as the price begins to “walk” in increasing volatility (the expansion of the bands).
Stop-loss orders can be placed below the lower Bollinger Band or at the lowest point of the descending price channel. Profit-taking levels can be set at previous key resistance levels; however, it is important to maintain a positive risk:reward ratio. Since a breakout trade can potentially reverse the trend, traders should consider multiple profit levels and adjust stop-loss orders manually or use a trailing stop.
2.2. Trend Following Strategy
Combining Bollinger Bands and MACD can also be used in trending markets through the following steps:
- Identify the trend using the MACD indicator.
- Use bounces off the MA20 line as potential entry points (in line with the trend).
- Look at the MACD indicator to confirm trend continuation.
- Use the lower (or higher) band as a stop-loss level in an uptrend (or downtrend).
The chart of the EUR/USD pair below illustrates the Bollinger and MACD trend-following strategy. The MACD indicator confirms the uptrend, with the MACD line above the signal line and both lines above the zero line. This indicates that traders should only look for buy entry points.
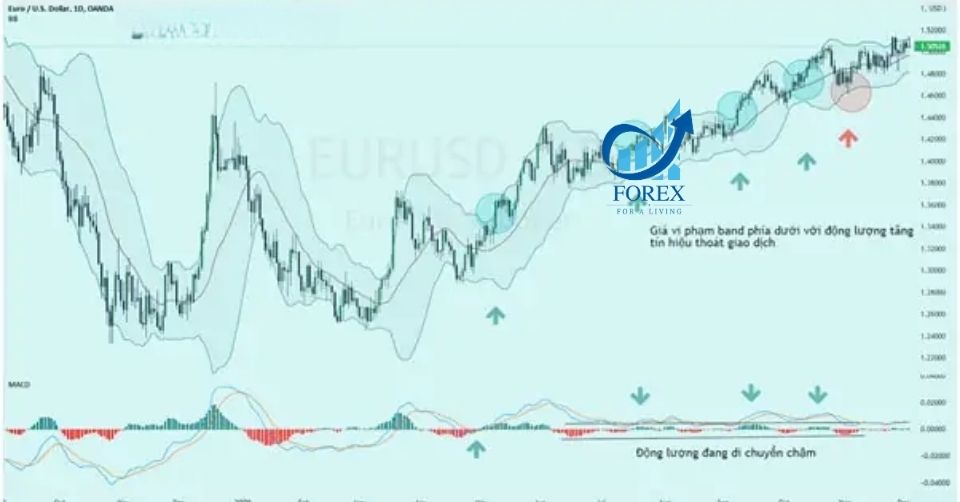
Momentum Slowing Down and Continuation of Uptrend
After the initial surge, momentum slows down, and although the MACD line crosses below the signal line, these moves are accompanied by low volume, leading to a sideways movement in the short term rather than a reversal against the prevailing trend.
The upward trend is further strengthened, as evidenced by the price bouncing off the MA20 line and continuing to form higher highs and higher lows.
Traders can enter buy positions to align with the Bollinger Band Squeeze (green arrow). Buyers can choose to exit the trade when the price drops down to the MA20 line or look for a break below the lower Bollinger Band as a signal to exit the trade.
Traders may use manual stop-loss orders or a trailing stop along the lower Bollinger Band as the price increases. Profit-taking levels can be set at key support and resistance levels; however, proper risk management should always be maintained.
3. Advantages and Disadvantages of Bollinger Bands and MACD
Advantages:
- The Bollinger Bands indicator can be applied to any asset, across all timeframes, and the MACD indicator works similarly.
- Bollinger Bands provide stop-loss levels that align with the lower band for buy trades and the upper band for sell trades.
- Traders can quickly assess the trend and volatility of any market.
Disadvantages:
- The combination of Bollinger Bands and MACD is not suitable for new traders, as it requires a deep understanding of both indicators.
- Bollinger Bands are known to work most effectively in ranging markets, while MACD is a trend-following momentum indicator. If these indicators are applied incorrectly, traders may receive false signals.
- t.me/finance_solutes
- Website: https://finance-solutes.com
- Hotline: +1 929 5636 439 ( Hotline )
- 26 Broadway, Suite 934, New York, 10004, US
