
 XM
XM Bybit
Bybit Binance
 Robinhood
 Webull
 IC Markets
 Pepperstone
 OKX
OKX Vantage
 VT Markets
 BingX
BingX Gate.io
 Kucoin
 MEXC
MEXC Exness
 Bitget
The Fractal Indicator might not be as well-known as indicators like MACD or RSI for most traders. When people hear the term “Fractal,” they often associate it with a complex concept in mathematics.
However, the Fractal Indicator in trading is far simpler. It is a powerful tool for identifying reversal points or providing potential stop-loss levels.
So, what exactly is the Fractal Indicator? How do you interpret Williams Fractals to effectively spot reversal points? How does the indicator identify reversals in detail? Let’s dive into the article below!
1. What is the Fractal Indicator?
The Fractal Indicator is a tool used on candlestick charts to identify reversal points in the market. Traders commonly use Fractals to get an idea of the direction in which the price might move. A Fractal forms when a specific price pattern occurs on the chart.
The Fractal Indicator is a technical tool developed by renowned trader Bill Williams and was introduced to the public through his book “Trading Chaos.” As a result, it is also called the Williams Fractal Indicator.
Bill Williams developed the Fractal Indicator based on the “Chaos Theory” and market psychology. This indicator is built on the idea that price behavior repeats itself, and fractals provide insights into that repetition.
The Fractal Indicator appears as reversal arrows on the chart, which can be either green (indicating a bullish trend) or red (indicating a bearish trend).
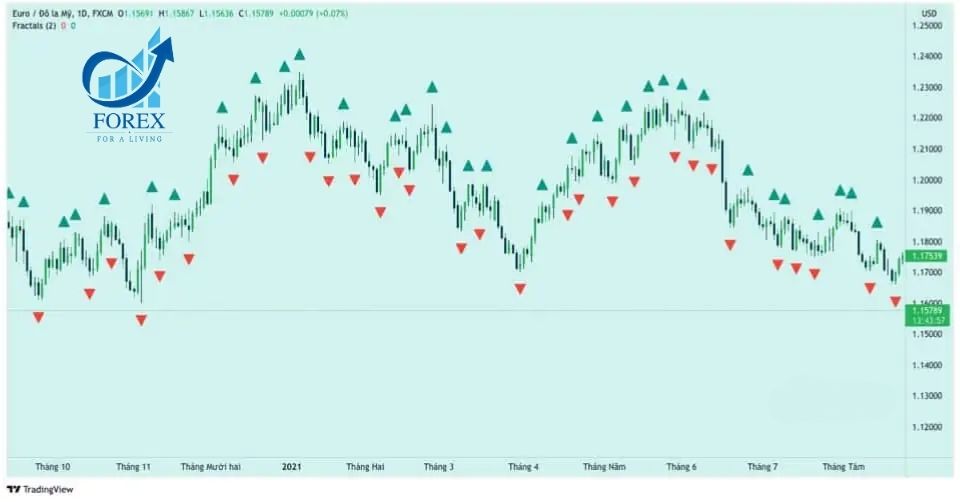
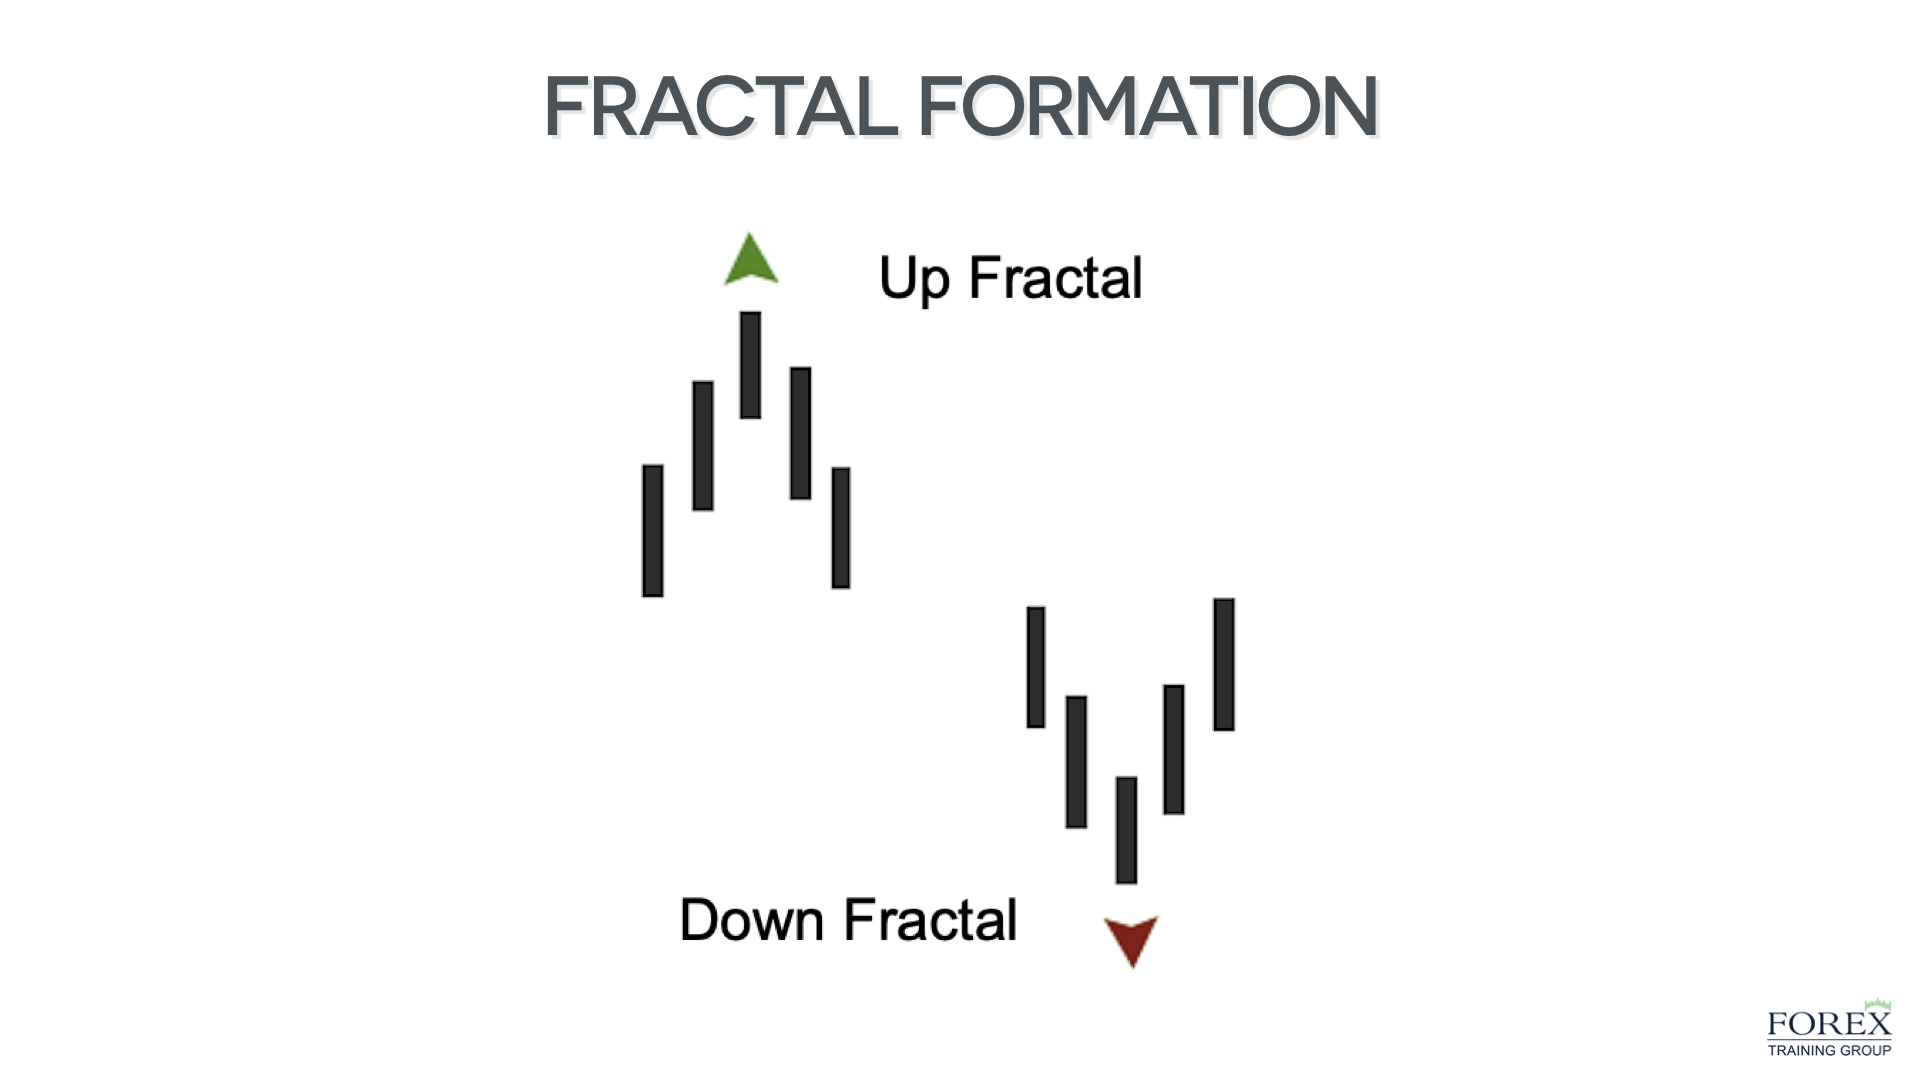
The Fractal pattern consists of multiple candles that form a shape resembling the letter “V” or “U” due to price action. The rules for identifying Fractal Indicators are as follows:
- A bearish Fractal occurs when there is a pattern with the highest candle in the middle and lower candles on both sides.
- Conversely, a bullish Fractal appears when there is a pattern with the lowest candle in the middle and higher candles on both sides.
It might sound a bit confusing at this point, right? Well, let’s take a look at the illustration below to clarify!
-
INSTALLING THE FRACTAL TOOL ON MT4 AND TRADINGVIEW
Fractals are an excellent tool for technical analysis and enhancing forex trading plans and strategies. Setting up the Fractal tool on trading platforms like MT4 or TradingView is quite simple!
2.1. Fractal Indicator on MT4
Just like other technical indicators, after opening the MT4 platform, go to the Insert menu on the top bar → Select Indicators → Choose Bill Williams → Select Fractals.
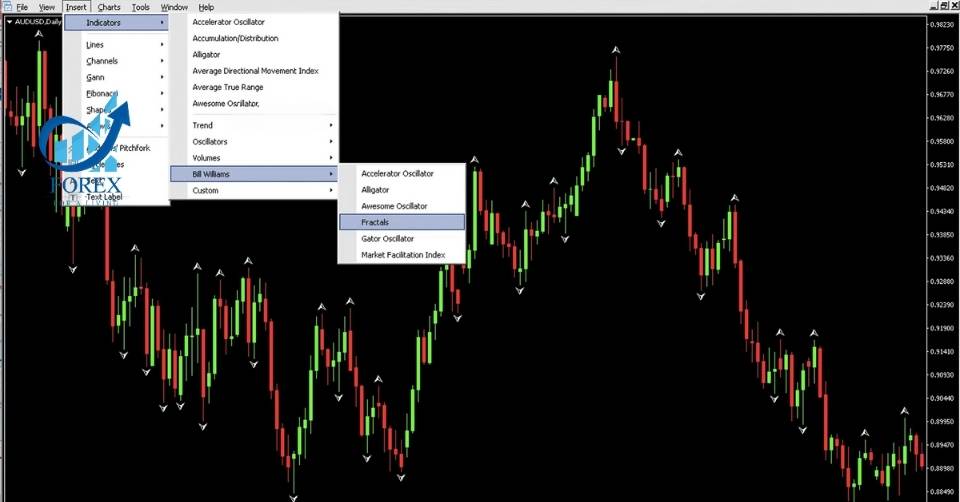
Most trading platforms integrate the Williams Fractals indicator for free. Traders do not need to worry much about the calculations behind this indicator. However, if your trading platform doesn’t have the Fractals indicator by default, you can download the free Fractals Indicator from Tradafx via the link below.
2.2. Fractal Indicator on TradingView
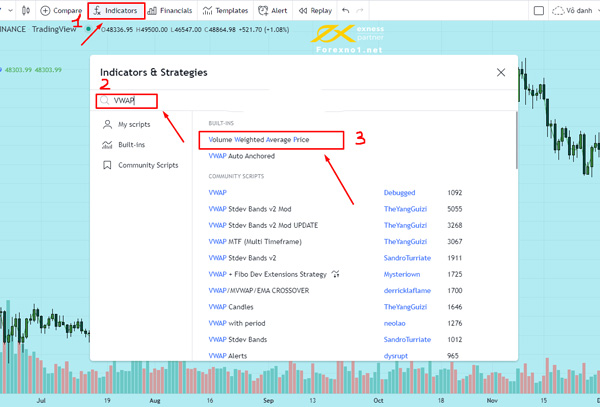
The Fractals tool on TradingView is similar to other technical indicators. Open the TradingView chart platform, select the currency pair you want to analyze → Go to Indicators → Type “Fractals” in the search bar → Choose Williams Fractals.
- How to Use the Fractal Indicator in Forex
The Fractal indicator appears and signals quite frequently in the market. However, not every occurrence is “worth” trading.
Traders often combine the Fractal indicator with Dow Theory.
Essentially, the Fractal indicator signals trend changes. By observing the shape of the Fractal pattern, you can determine whether it indicates an uptrend or a downtrend.
As mentioned earlier, the Williams Fractals indicator appears as reversal arrows positioned directly above or below the price candles on the chart.
These reversal arrows will appear above or below the highest or lowest candles within the Fractal pattern.
3.1. Identifying Reversal Points with the Fractal Indicator
Although some traders consider the Fractal indicator to be outdated in today’s market, the tool developed by Bill Williams is still widely used by traders.
You can use the Fractal tool to identify potential breakouts by observing the current Fractal’s position in relation to the previous Fractal.
Bill Williams himself stated that when the price moves above or below a previous Fractal by one or more points, this signals a potential breakout.
- If the price breaks above a bullish Fractal pattern, the market trend is expected to be upwards.
- Conversely, if the price breaks below a bearish Fractal pattern, the market trend is expected to be downwards.
3.2. Combining with Other Technical Indicators
The Fractal pattern appears quite frequently in the market. To avoid falling for false signals generated by this indicator, it’s best to combine Fractals with other technical indicators.
In addition to Fractals, Bill Williams also developed another trend-following indicator called the Alligator. By combining Fractals with the Alligator indicator in trend analysis, traders can confirm the trend and enter positions that align with the prevailing market direction.
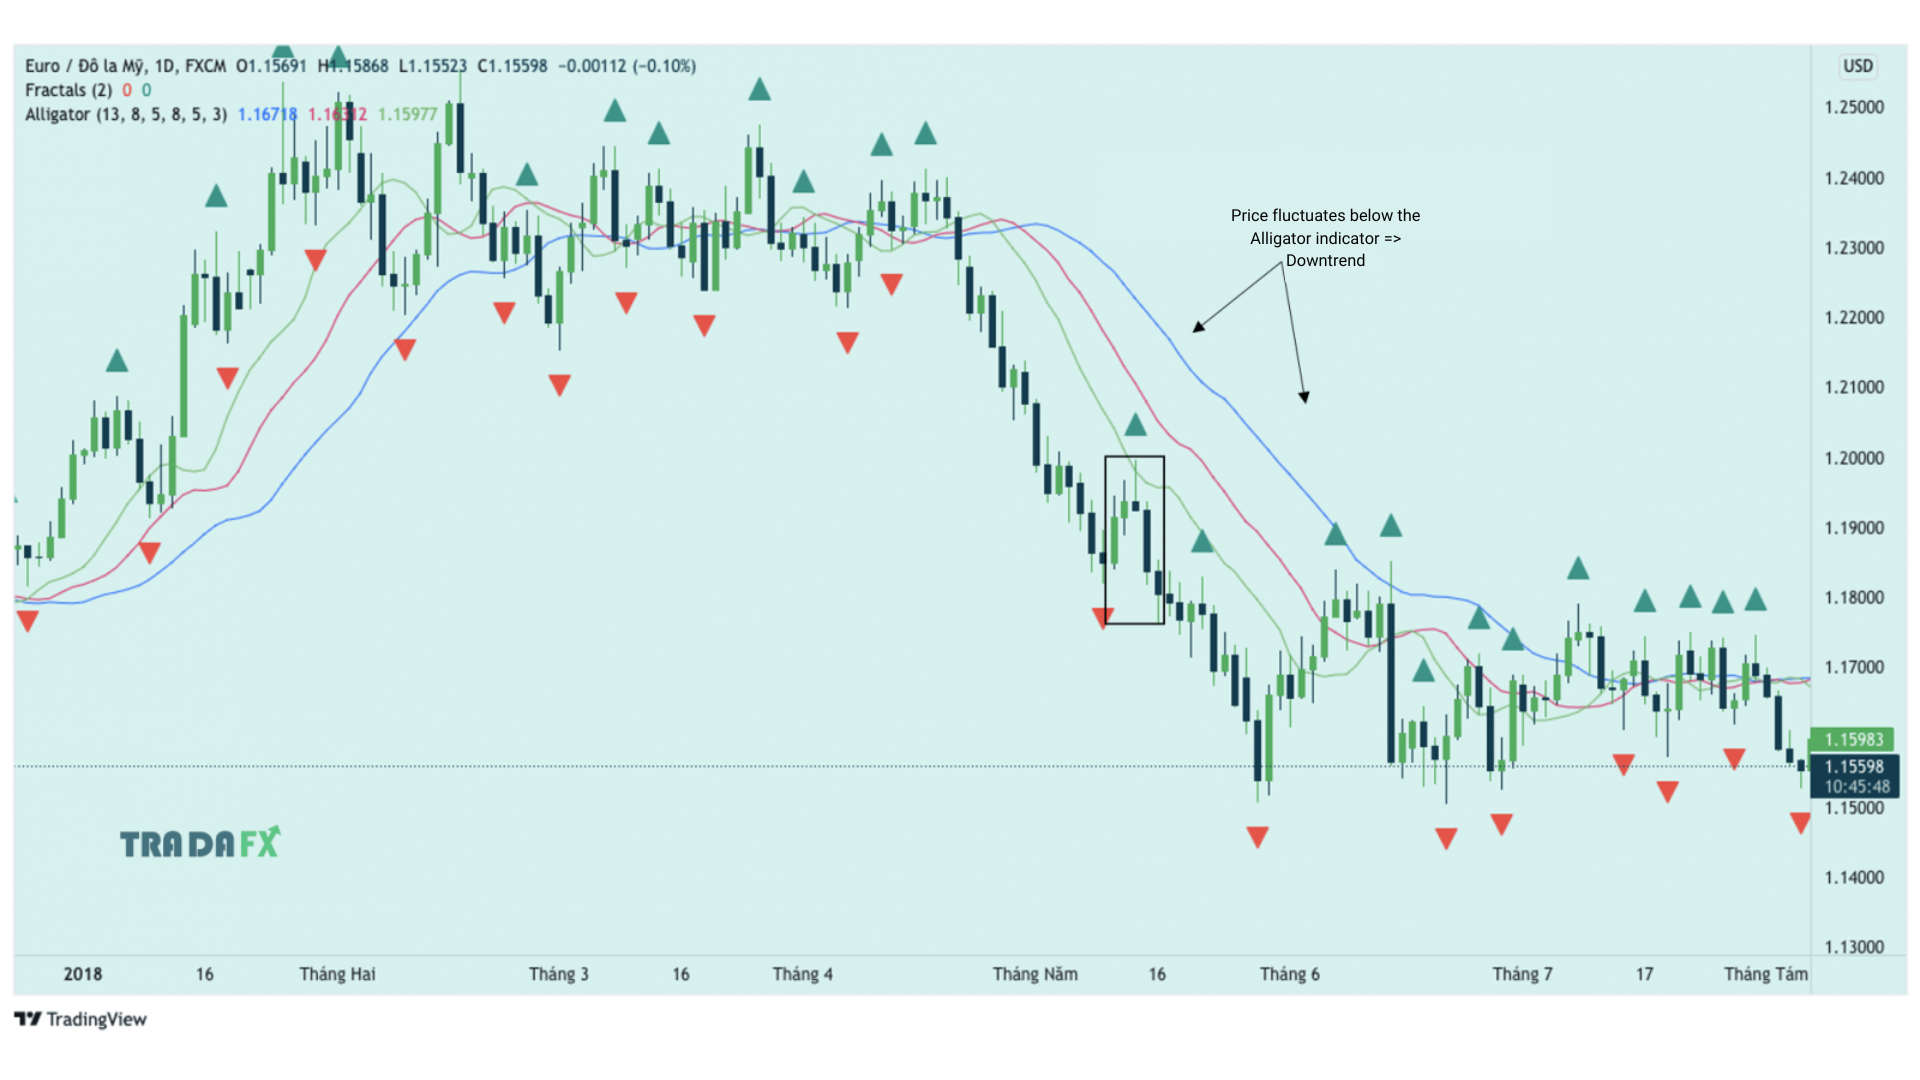
Example:
In a downtrend, traders may only look for selling opportunities based on the bearish Fractal indicator. Trend confirmation can be obtained by checking whether the price is oscillating above or below the Alligator indicator.
Additionally, the Fractal indicator can also be combined with Pivot Points or Fibonacci retracement levels, depending on the specific conditions. For example, if the price is trending higher and then experiences a pullback, reaching the 50% Fibonacci retracement level, traders may enter a trade if a bullish Fractal appears.
Moreover, traders can use the Fractal indicator to determine where to place stop-loss orders.
- For a sell position, the stop-loss will be placed above the previous Fractal high.
- Conversely, for a buy position, the stop-loss will be placed below the previous Fractal low.
4. Advantages and Disadvantages of the Fractal Indicator
| Advantages | Disadvantages |
|---|---|
| – Provides signals that make it easier to identify entry points. | – Fractal patterns appear frequently, so false signals are common. |
| – Helps traders with stop-loss placement. | – Offers fewer ideal entry points. |
| – Can act as support or resistance levels. |
5. Things to Note When Using the Fractal Indicator
A Fractal pattern must be confirmed after the close of the fifth candle in the pattern. In other words, you need to wait for the close of the fifth candle to see if a valid Fractal pattern has formed.
However, an incomplete Fractal pattern can signal potential future price volatility.

Example:
For instance, suppose four out of five candles form a bearish Fractal pattern. However, the fifth candle appears, and instead of having a lower low compared to the fourth candle, it shows the price moving upwards to a new high, even higher than the third candle’s high.
In this case, the bearish Fractal pattern becomes invalid. In fact, it signals that the current uptrend is likely to continue, and the price may rise to new highs.
Furthermore, Fractals formed on higher timeframes are generally more reliable. In other words, long-term Fractals are more trustworthy than short-term ones.
6. Summary
These basic Fractal indicator trading techniques will point you in the right direction if you’re looking for a solid strategy to use with this tool. While the Fractal indicator is a lagging indicator, many traders believe it rarely yields profits.
This is not true. When used in conjunction with price action analysis, the Fractal strategy can complement other excellent indicators. So, if you’ve been skeptical about this indicator, try it out and let TradaFX know your trading results!
- t.me/finance_solutes
- Website: https://finance-solutes.com
- Hotline: +1 929 5636 439 ( Hotline )
- 26 Broadway, Suite 934, New York, 10004, US
