
 XM
XM Bybit
Bybit Binance
 Robinhood
 Webull
 IC Markets
 Pepperstone
 OKX
OKX Vantage
 VT Markets
 BingX
BingX Gate.io
 Kucoin
 MEXC
MEXC Exness
 Bitget
1. WHAT IS THE EMA LINE?
The Exponential Moving Average (EMA) is one of the most commonly used tools in Forex trading. Traders use the EMA on trading charts to identify entry and exit points based on the price action’s position relative to the EMA line.
As mentioned in the previous article, Simple Moving Averages (SMA) can be “noisy” due to sudden price spikes. Let me start with an example.
Let’s assume I plot a 5-period SMA on the daily chart of the EUR/USD pair.
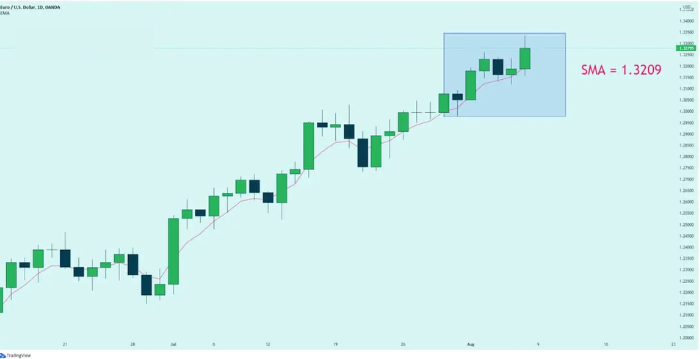
The closing prices for the last 5 days are as follows:
- Day 1: 1.3172
- Day 2: 1.3231
- Day 3: 1.3164
- Day 4: 1.3186
- Day 5: 1.3293
To calculate the Simple Moving Average (SMA) for this period, we add the closing prices and divide by 5:

Let’s look at the updated closing prices:
- Day 1: 1.3172
- Day 2: 1.3000
- Day 3: 1.3164
- Day 4: 1.3186
- Day 5: 1.3293
To calculate the Simple Moving Average (SMA) again, we add the closing prices and divide by 5:

The result of the simple moving average (SMA) will be much lower, and it will show you that the price is actually decreasing, while in reality, day 2 is just a one-time event due to the negative result of an economic report.
Sometimes the simple moving average can be too simple.
If only there were a way to filter out these sudden fluctuations so you wouldn’t be misled.
Hmm… Wait a second… Right, there is a way!
1.1. EMA is called the Exponential Moving Average!
The Exponential Moving Average (EMA) gives more weight to the most recent periods.
In the example above, the EMA will place more weight on the prices of the most recent days, which would be days 3, 4, and 5.
This means that the spike in price on day 2 will have a lower value and will not have as much of an impact on the average line as when we calculate it for a simple moving average.
If you think about it, this makes a lot of sense because what it does is give more emphasis to what traders are doing recently.
1.2. When is EMA the best?
The Exponential Moving Average (EMA) is a technical chart indicator that tracks the price of an investment (like stocks or commodities) over time. EMA is a type of weighted moving average (WMA) that gives more weight or greater importance to recent price data.
The 8-day and 20-day EMA are the most popular timeframes for day traders, while the 50-day and 200-day EMAs are more suitable for long-term investors.
1.3. How to calculate EMA
The Exponential Moving Average (EMA) is more complex to calculate than the Simple Moving Average (SMA). The calculation for the SMA is simply based on the closing price, while for the EMA, we need to add a multiplier to the EMA calculation formula.
Here is the formula for calculating EMA:
EMA = K x (Giá đóng cửa hiện tại – EMA trước đó) + EMA trước đó
In which:
K: The weight of the EMA = 2/(n+1)
n: The number of periods
Previous EMA: The EMA value from the previous trading day.
Note: If calculating the EMA for the first time, the previous EMA value is simply the average of the closing prices over “n” periods (the SMA).
2. EMA LINE WITH SMA
Let’s take a look at the 4-hour chart of the USD/JPY pair to clarify what the Simple Moving Average (SMA) and the Exponential Moving Average (EMA) look like on the chart.
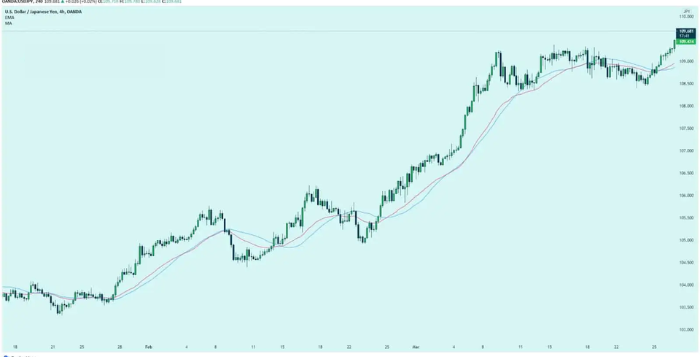
Note that the red line (30 EMA line) seems to reflect the price more closely compared to the blue line (30 SMA line).
This means it represents recent price action more accurately. You can guess why this happens.
It’s because the Exponential Moving Average (EMA) places more importance on what’s happening recently.
When trading, it’s important to focus on what traders are doing RIGHT NOW rather than what they did last week or last month.
- t.me/finance_solutes
- Website: https://finance-solutes.com
- Hotline: +1 929 5636 439 ( Hotline )
- 26 Broadway, Suite 934, New York, 10004, US
