
 XM
XM Bybit
Bybit Binance
 Robinhood
 Webull
 IC Markets
 Pepperstone
 OKX
OKX Vantage
 VT Markets
 BingX
BingX Gate.io
 Kucoin
 MEXC
MEXC Exness
 Bitget
Leading Indicators vs. Lagging Indicators – Lagging indicators use past price data to provide entry/exit signals, while leading indicators give traders clues about future price movements, although both still rely on past price data.
When faced with the choice between leading and lagging indicators, the decision ultimately depends on personal preferences after understanding the pros and cons of each type.
1. LEADING INDICATOR
A leading indicator is a technical indicator that uses past price data to forecast future price movements in the forex market. While no indicator can predict future prices with 100% accuracy, traders can anticipate how prices might behave in the future and then use deeper analysis to identify ideal entry points for market participation.
Here are some examples of leading indicators:
1.1. Leading Indicator in Fibonacci Retracement
Fibonacci retracement levels consist of numbers or ratios that have mathematical significance in nature and are frequently observed in financial markets. The most important number or ratio is the 61.8% level (or 0.618). In forex trading, Fibonacci retracement levels can help identify potential support and resistance levels in the future.
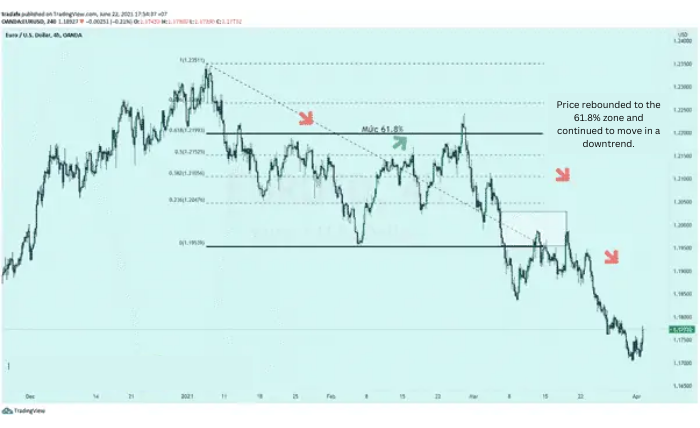
The chart of the EUR/USD pair below suggests that the price might continue its downtrend if the 61.8% level is not broken.
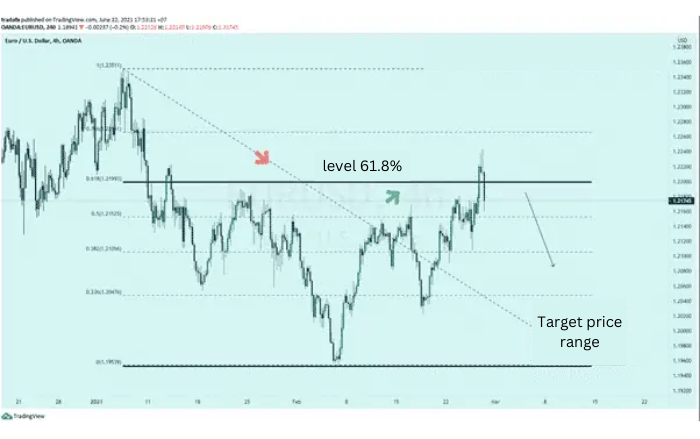
If the 61.8% level is not broken, the market is likely to continue its downtrend and may surpass the original price target, creating a series of lower lows.
1.2. Leading Indicator in Donchian Channels
The Donchian Channels calculate the highest and lowest prices over a specific period and represent them with an upper and lower band. These bands are updated as the price continues to move.
The Donchian Channel indicator is well-suited for breakout or reversal trades in strongly trending markets. For example, the chart of the USD/JPY pair below shows how Donchian Channels can help traders identify breakouts.
- The price begins to create lower lows and touches the lower boundary of the channel before rising.
- The price breaks above the upper channel after touching the lower channel, providing the first bullish signal. A breakout above the upper channel after touching the lower channel is considered the first signal for a buy trade.
- The upper channel at point 2 extends a horizontal line to the right, corresponding to the recent high. This acts as a resistance level and provides additional confirmation if the price breaks above this level. Despite a significant retracement, the price does not break the lower channel and eventually moves back up, surpassing point 3.
A buy signal is triggered when the price moves up from the lower channel (1) to break the upper channel for the first time (2).
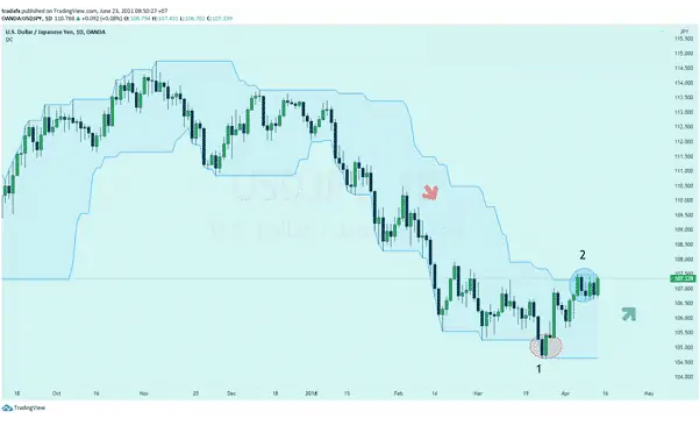
The upper channel extends to the right and provides a resistance level that needs to be tested. With a buy trade setup, traders will look for the price to break this level, which would create higher price levels.
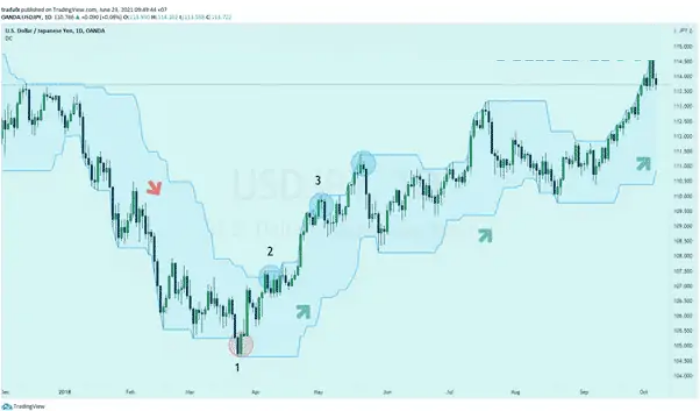
Even though there is a significant retracement between points (2) and (3), the price does not break the lower channel and eventually moves back to create a new high at point (3).
In an upward move, as seen above, traders can use the lower channel as a trailing stop and adjust it upwards as the market rises.
1.3. Leading Indicator in Key Support and Resistance Levels
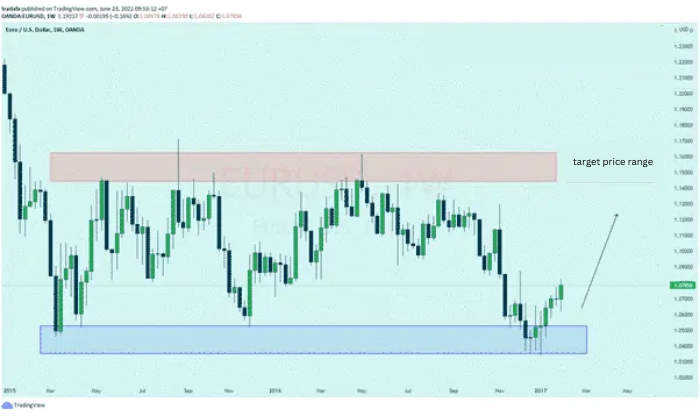
Key support and resistance levels occur when the price approaches a specific level multiple times without breaking through it. This often leads to the price bouncing off these significant barriers within a range. Knowing where the price has been in the past can help traders evaluate where to place take profit and stop loss orders.
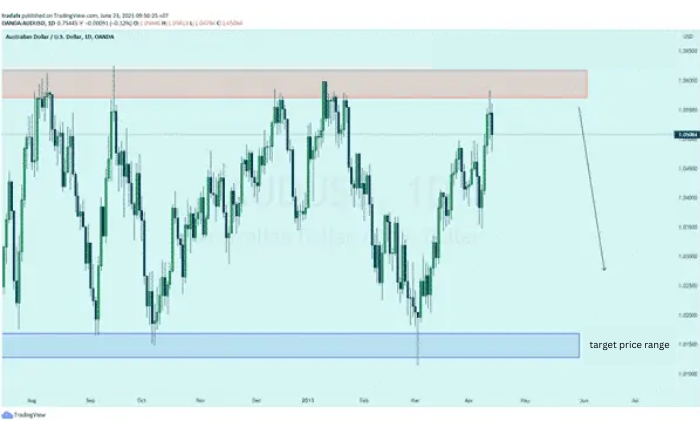
In this example, the price approached the resistance level and reversed, meaning the take-profit order should be placed at the support level or just below it, with a stop-loss order placed above the resistance level. This setup ensures a proper risk-reward ratio. The price then continues to decrease and eventually touches the support level.
2. LAGGING INDICATOR
In contrast to leading indicators, lagging indicators use past price data to predict future price levels. Lagging indicators confirm recent price changes and are primarily used to analyze the market by calculating the average of past price actions.
Lagging indicators are tools that traders use to evaluate market trends, entry, and exit points. While they are considered most effective in trending markets, many signals occur after the price movement has already happened, leading to fewer profitable pips for traders.
Here are some examples of lagging indicators:
Lagging indicators are often associated with moving averages.
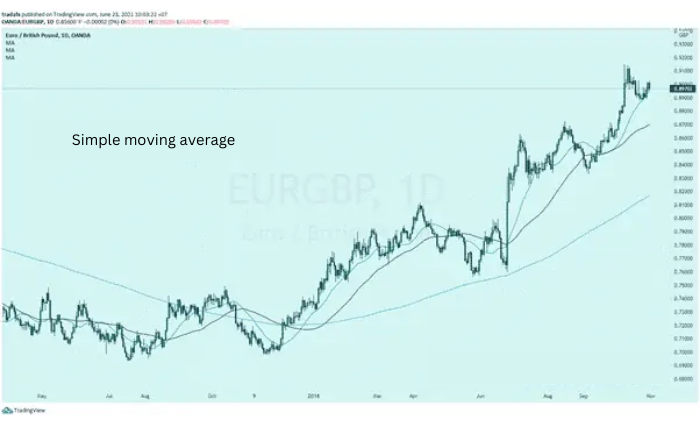
2.1. Simple Moving Average (SMA)
The Simple Moving Average (SMA) is a lagging indicator that represents the average closing price of a financial instrument over a specific time frame.
2.2. Exponential Moving Average (EMA)
EMA is a lagging indicator; it is the result of calculating the SMA, with the only difference being that EMA gives more weight to recent price fluctuations.

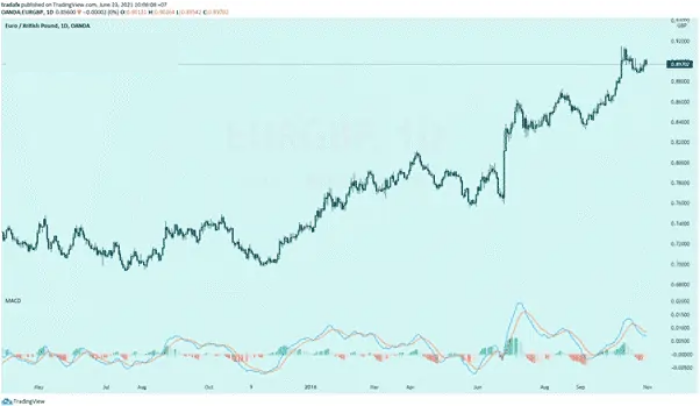
2.3. MACD
MACD is a lagging indicator used to calculate the relationship between different EMA lines.
3. ADVANTAGES AND DISADVANTAGES OF FAST/SLOW INDICATORS
Here is the table for the advantages and disadvantages of fast and slow indicators:
| Advantages | Disadvantages | |
|---|---|---|
| Fast Indicators | – Provide favorable entry points when trading | – Price action forecasting is not guaranteed. Traders need to apply their own knowledge of these indicators in each specific situation |
| – Help traders focus on high-probability trades as they identify important price areas | – Fast indicators are often used in advanced technical analysis theories, such as Elliott Wave Theory, which can be challenging for new traders | |
| Slow Indicators | – Provide greater confidence to enter trades by confirming recent price actions | – Traders must sacrifice a certain number of pips while waiting for confirmation from lagging indicators |
| – Reduce the risk of false moves and false breaks | – Slow indicators do not have a concept of important price areas, so traders need to be aware of this. |
4. SHOULD YOU USE FAST OR SLOW INDICATORS?
There is no perfect indicator. By nature, indicators help traders detect outcomes, but the opposite can also occur when you are confident in the market. Therefore, traders must conduct thorough analysis with the aim of placing the odds in their favor.
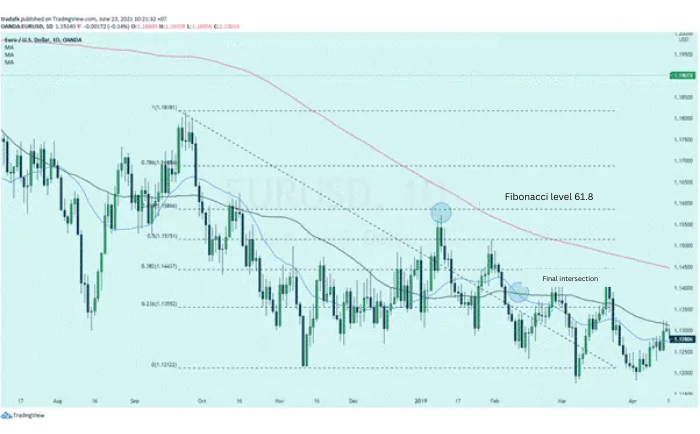
To further illustrate this, here is an example of fast and slow indicators for the EUR/USD pair, where the fast indicator appears to provide a better signal. Remember that this is purely for demonstration purposes, and slow indicators are just as important.
The market experienced a strong sell-off before returning to the 61.8% level. Using simple moving averages (21, 55, 200), it’s clear that the faster blue line (21) has not crossed below the slower black line (55), so this slow indicator has not provided a sell signal yet.
However, upon deeper analysis, traders can see that the market has failed to break and remains above the 200-day moving average. The 200 SMA is widely seen as an excellent long-term trend indicator, and in this case, it’s acting as a resistance level. This supports a sell position for traders who see a recovery below the 61.8% level.
Traders looking for quick signals tend to prioritize fast indicators but may also reduce the time setting on slow indicators to make them more responsive. However, this must always be done with tight stop-loss levels in case the market moves in the opposite direction.
Traders seeking a higher level of confidence tend to favor lagging indicators. These traders often trade in longer timeframes to capitalize on continued momentum after entering a trade relatively slowly, while also practicing proper risk management.
5. SUMMARY
Lagging indicators are often misunderstood in terms of their nature, but they are an excellent method for analyzing financial markets. They are extremely versatile in the information they provide, which enhances trading strategies or offers additional support for traders’ analysis.
Fast indicators provide traders with signs of future price movement and, furthermore, appropriate stop-loss and take-profit points. However, the reality is that uncertainty exists when trading in financial markets, so traders cannot comfortably apply both fast and slow indicators to risk management. Simply put, a fast indicator only provides direction and magnitude for future price movements. Remember that prudent risk management should be applied at all times.
- t.me/finance_solutes
- Website: https://finance-solutes.com
- Hotline: +1 929 5636 439 ( Hotline )
- 26 Broadway, Suite 934, New York, 10004, US
