
 XM
XM Bybit
Bybit Binance
 Robinhood
 Webull
 IC Markets
 Pepperstone
 OKX
OKX Vantage
 VT Markets
 BingX
BingX Gate.io
 Kucoin
 MEXC
MEXC Exness
 Bitget
What Is the Stochastic RSI Indicator?
The Stochastic RSI is created by applying the Stochastic RSI formula to a set of RSI indicator values.
The Stochastic RSI is known as an extremely useful indicator for traders in the market. It is a type of technical indicator that helps traders identify market trends. So, what exactly is the StochRSI indicator? Let’s dive into the details of this topic with TradaFX in today’s article. Let’s get started!
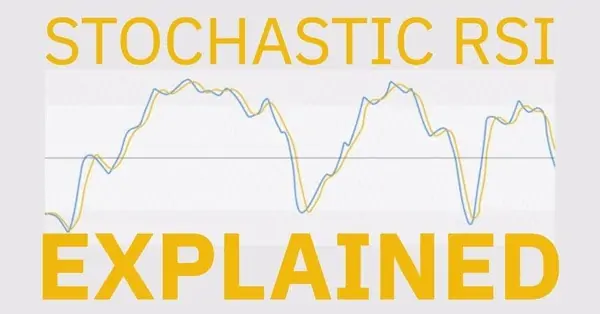
1. What is Stochastic RSI?
Stochastic RSI, also known as Stochastic Relative Strength Index, is a technical analysis indicator with values ranging from 0 to 1 (or 0 to 100 on certain price charts). This indicator is used to determine whether an asset is overbought or oversold and to identify the current market trend.
Stochastic RSI is a derivative of the Relative Strength Index (RSI), which makes it an “indicator of an indicator.”
2. Stochastic RSI Formula
The formula to calculate Stochastic RSI is:
Stoch RSI = (Current RSI – Lowest RSI) / (Highest RSI – Lowest RSI)
Where:
- Current RSI: The present RSI value.
- Lowest RSI: The lowest RSI value over the last 14 trading sessions (or any chosen period).
- Highest RSI: The highest RSI value over the last 14 trading sessions (or any chosen period).
On some Stochastic RSI charts, values range from 0 to 100 instead of 0 to 1. In these cases, the midpoint is set at 50 rather than 0.5. Overbought signals typically occur at 80 (0.8), and oversold signals appear at 20 (0.2). The interpretation of these charts remains consistent regardless of the scale.
3. Stochastic RSI – Characteristics of Stochastic RSI
Stochastic RSI was developed to enhance sensitivity and generate more accurate signals compared to traditional indicators such as RSI and MACD.
- When the Stochastic RSI value is below 20 (0.2), the asset is considered oversold, meaning the RSI is trading at the lower end of its predefined range.
- Conversely, when the Stochastic RSI value exceeds 80 (0.8), the asset is deemed overbought. This indicates that the current RSI is at an extreme high, signaling a potential price reversal in the underlying asset.
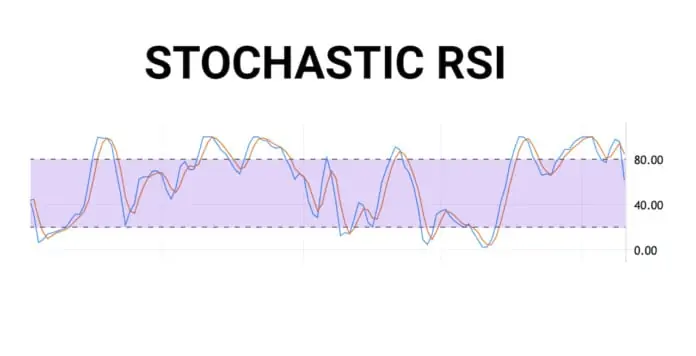
Additionally, Stochastic RSI can also be used to identify short-term trends by comparing its value to the midpoint of 50 (0.5):
- When Stochastic RSI is above 50 (0.5): The asset may be considered to have a stronger upward trend.
- When Stochastic RSI is below 50 (0.5): The asset tends to exhibit a downward trend.
4. Distinguishing Stochastic RSI and RSI
Both Stochastic RSI and RSI are stochastic oscillators that help traders identify potential overbought and oversold conditions, as well as possible reversal points.
However, these two indicators are calculated using different formulas, leading to some key differences:
- The standard RSI is a relatively slower-moving indicator, producing fewer trading signals.
- By applying the Stochastic oscillator formula to the regular RSI, Stochastic RSI becomes a more sensitive indicator.
This heightened sensitivity enables Stochastic RSI to generate a greater number of signals, providing traders with more opportunities to identify market trends and potential entry or exit points.
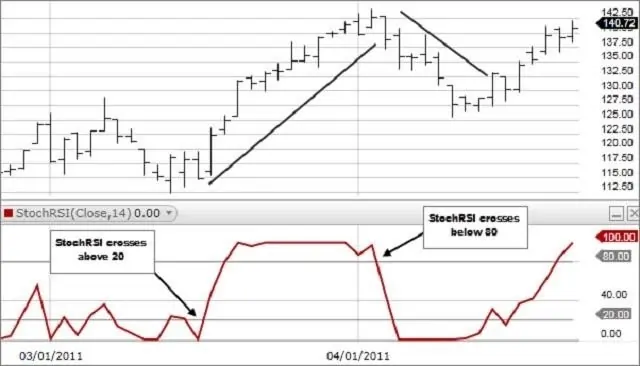
In other words, the Stochastic RSI oscillator is a highly volatile indicator, making it a more sensitive technical analysis tool that can provide traders with numerous trading signals. However, more signals also mean increased risks (more noise). Therefore, it is recommended to use the Stochastic RSI in conjunction with other technical analysis tools to validate the signals it generates.
5. How to Use the Stochastic RSI Indicator
The primary function of the Stochastic RSI is to identify overbought and oversold levels within a given timeframe. At these levels, it is advisable to combine the indicator with additional conditions to determine entry and exit points. Below are some methods for using the Stochastic RSI effectively:
- Combine with reversal candlestick patterns at overbought and oversold levels in larger timeframes.
- For example: When the Stochastic RSI reaches 0.8, indicating an overbought zone, you can add conditions such as reversal candlestick patterns like engulfing or piercing patterns for confirmation.
- Use support and resistance levels to refine entry decisions.
- When the price reaches a support level and the Stochastic RSI is below 0.2, you may consider a buy order. Conversely, for resistance levels, a sell order can be considered when the indicator is above 0.8.
- Incorporate other conditions tailored to specific traders, markets, or instruments.
- The choice of additional conditions depends on individual trading strategies and preferences. Each trader should develop a unique trading system and thoroughly backtest it before live trading.
6. Summary
Thanks to its speed and sensitivity to market fluctuations, the Stochastic RSI is a highly valuable indicator for traders in both short-term and long-term analysis.
We hope that this guide by TradaFX has helped you understand what the Stochastic RSI indicator is and how it can be applied in the Forex market.
Wishing you successful trades!
- t.me/finance_solutes
- Website: https://finance-solutes.com
- Hotline: +1 929 5636 439 ( Hotline )
- 26 Broadway, Suite 934, New York, 10004, US
