
 XM
XM Bybit
Bybit Binance
 Robinhood
 Webull
 IC Markets
 Pepperstone
 OKX
OKX Vantage
 VT Markets
 BingX
BingX Gate.io
 Kucoin
 MEXC
MEXC Exness
 Bitget
Top 4 Trend Indicators for Effective Trend Identification in Forex – Each trend indicator comes with its own strengths and weaknesses. Depending on the trading style and strategy of each trader, they will choose the most suitable trend indicators alongside price action observation.
Most traders aim to identify the market trend and its relative strength. This helps them trade in the direction of the trend rather than against it. So, which trend indicators can assist traders in doing this? Let’s dive into this topic in the next part of this Forex knowledge series!
1. Trend Indicators
Trend indicators, or chỉ báo xu hướng, are tools that help traders determine whether the market is trending and, if so, which direction the trend is moving. These indicators assist traders in analyzing the market over a chosen timeframe, helping identify the prevailing trend. They are essential in trend-following strategies, allowing traders to make informed decisions about when to enter or exit trades.
In addition to identifying the trend, traders can also use momentum indicators to assess the strength of the trend. These indicators can signal potential reversals or continuation of the trend.
2. Top 4 Trend Indicators
2.1. Moving Average
The purpose of using trend indicators is to identify signals for executing buy or sell trades. The first and simplest indicator in this category is the Moving Average (MA).
A Moving Average represents the average closing price over a specific period. To understand this better, let’s take a look at two simple examples: one short-term and one long-term moving average.
- Short-term Moving Average (SMA or EMA): This type of moving average gives quick feedback on price movement, following the price closely. It’s used to identify more immediate trends.
- Long-term Moving Average (SMA or EMA): This type of moving average smoothens out short-term price fluctuations, offering a broader view of the market’s direction.
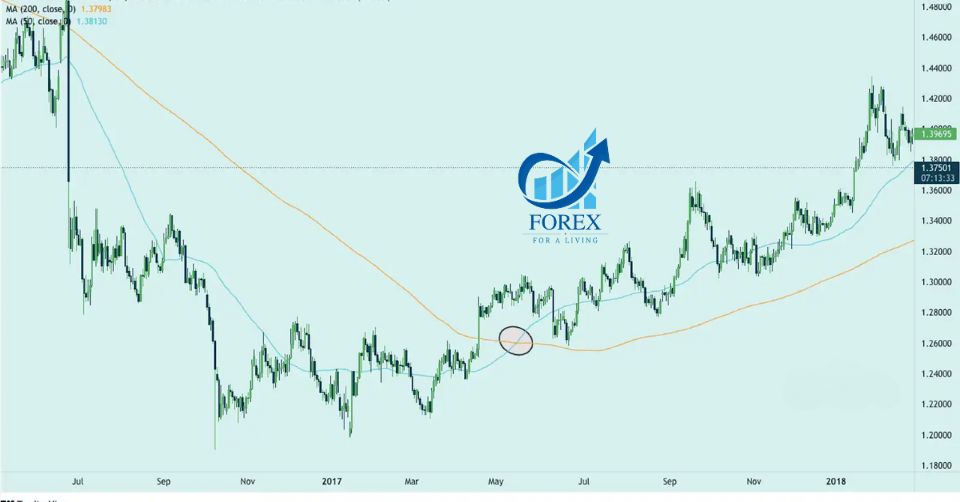
The key advantage of using moving averages is their simplicity and the clear signals they provide regarding market direction. Traders often use crossovers (when a short-term MA crosses above or below a long-term MA) as buy or sell signals.
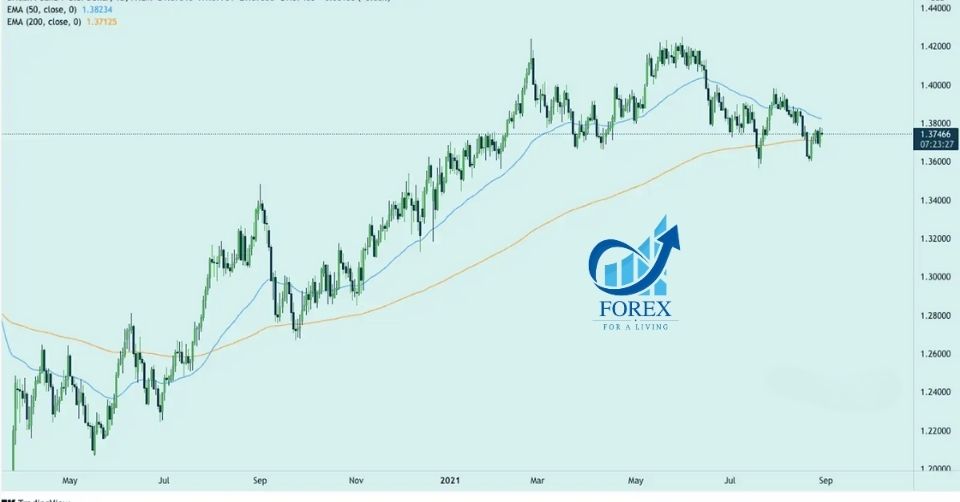
In the example above, the 50-period EMA (green) and 200-period EMA (orange) were used. The theory here is that a bullish trend occurs when the price is above the moving averages, and the 50-period EMA is above the 200-period EMA. The reverse is true for a bearish trend. In most cases, this combination does a great job of identifying the market’s trend. Additionally, crossovers between these moving averages can signal a potential price reversal.
Every trader usually has their preferred combination of moving averages they believe is the most effective. However, the truth is that there is no single “best” combination. Ultimately, forex traders will benefit the most by choosing a combination that suits their chosen timeframes. The trend indicated by this indicator will guide traders on whether to focus on long-term or short-term trades.
2.2. MACD Indicator
The MACD (Moving Average Convergence Divergence) indicator consists of three components: the MACD line, the Signal line, and the Histogram. This indicator measures the difference between two moving averages. Traders can use the MACD alone or combine it with the moving averages mentioned earlier.
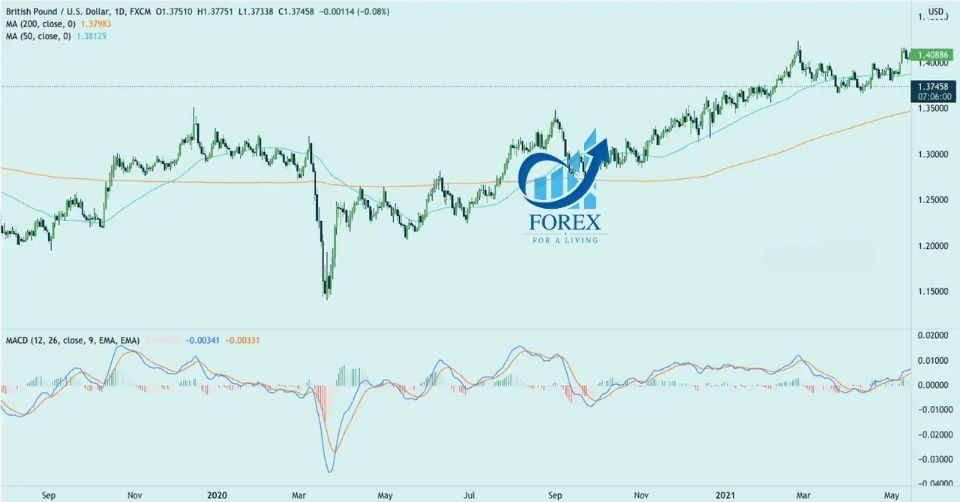
The MACD line is calculated by subtracting the 26-period EMA from the 12-period EMA, and the Signal line is the 9-period EMA of the MACD line. The Histogram shows the difference between the MACD and Signal line, and it provides a visual representation of momentum changes.
The MACD indicator is particularly useful for identifying the strength and direction of the trend and spotting potential trend reversals. When the MACD line crosses above the Signal line, it often signals a bullish trend. Conversely, when the MACD line crosses below the Signal line, it typically signals a bearish trend. The Histogram helps traders gauge the momentum and strength of these movements.
With the MACD indicator, traders can leverage the crossovers between the MACD line and the Signal line. As seen in the example chart above, when these two lines cross, the price tends to reverse direction.
One important note about the MACD is that it is based on moving averages of other moving averages. This means it has a certain degree of lag compared to the price. Therefore, the MACD might not be the best indicator for traders looking to catch trends early. However, it does an excellent job of confirming trends and can help traders understand the market’s momentum.
2.3. Bollinger Bands
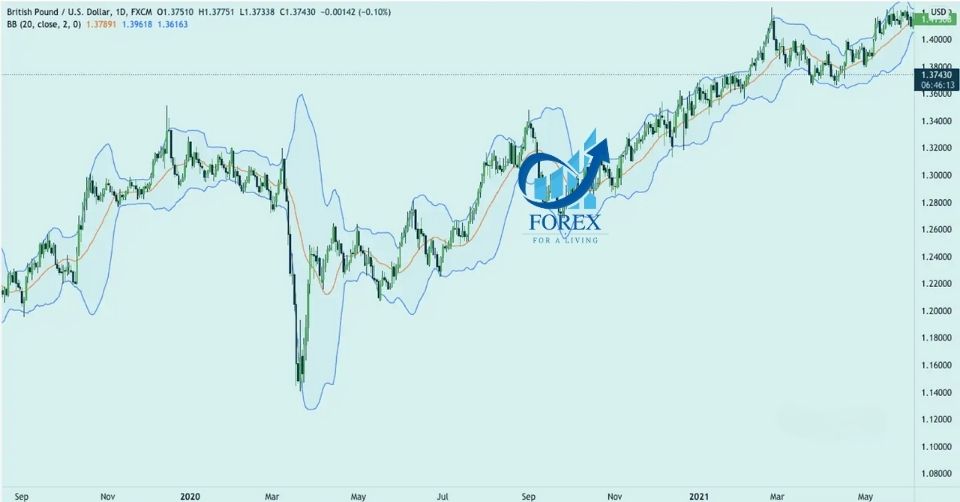
Bollinger Bands is a volatility indicator that consists of a middle band (usually a 20-period moving average) and two outer bands that are typically two standard deviations away from the middle band. This indicator adjusts dynamically based on market volatility, expanding when volatility is high and contracting when volatility is low.
One of the key advantages of Bollinger Bands is that traders can use it in both trend-following markets and range-bound markets. In a trending market, the price will often move along the upper or lower band, while in a ranging market, the price will tend to bounce between the upper and lower bands.
The squeeze—when the bands narrow significantly—can signal a potential breakout or a period of low volatility before the market makes a strong move. Traders watch for the price to break out of the bands to confirm the continuation of the trend. Conversely, when the price touches the bands, it may indicate an overbought or oversold condition, prompting a potential reversal.
When the distance between the two bands narrows, it signals that the market may be about to reverse. It doesn’t indicate the direction of the move; thus, traders should be prepared for price movement in either direction.
- If the candles break below the lower band, the price is likely to continue in a downtrend.
- If the candles break above the upper band, the price is likely to continue in an uptrend.
2.4. Relative Strength Index (RSI)
Once the trend is identified, traders need to determine the strength or weakness of the trend before deciding whether to enter a trade. If you decide to jump into a trade as quickly as possible, you may consider entering when the uptrend or downtrend is confirmed.
On the other hand, some traders may wait for a pullback within the larger trend, hoping that this will provide a lower-risk opportunity. For this, a trader would rely on an overbought/oversold indicator, and one well-known indicator that can achieve this is the Relative Strength Index (RSI).
RSI measures the magnitude of recent price changes to evaluate overbought or oversold conditions. It ranges from 0 to 100, where:
- An RSI above 70 is typically considered overbought, indicating the possibility of a price reversal or pullback.
- An RSI below 30 is typically considered oversold, suggesting that the price could reverse or bounce higher.
By using RSI, traders can assess the strength of a trend and look for potential opportunities to enter when the price is overextended, offering a better risk-to-reward ratio.
The RSI value can range from 0 to 100. If all price actions are upward, the indicator will approach 100; if all price actions are downward, the indicator will approach 0. An RSI value of 50 is considered neutral.
When the indicator moves between 70 and 100, the market is considered to be in an overbought state. If it moves between 0 and 30, the market is considered to be in an oversold state. The RSI can signal trend reversals, strength, and when the price is approaching the zero line.
3. Which Forex Trend Indicator is the Best?
As mentioned repeatedly in previous articles, questions like “Which indicator is the best?” or “Which trend indicator is the best?” always have the same answer: there is no one-size-fits-all best indicator. In other words, the best trend indicator for each trader is the one that fits their personal trading style.
For example, some traders may find the moving average to be the best technical analysis indicator for identifying trends due to its simplicity and ability to indicate the direction of price in trend-following trades. On the other hand, some traders prefer the MACD indicator because they value the confirmation it provides when identifying trends.
4. Conclusion
In the market, each trend indicator has its own strengths and weaknesses. Depending on the trader’s style and methodology, they will choose their own preferred trend indicators, in addition to observing price action.
Furthermore, traders can combine trend indicators to maximize accuracy and minimize risk. The key is not to overuse trend indicators and avoid cluttering the chart with too many indicators.
Tradafx hopes this article has helped you learn more about ways to identify trends and how to add indicators effectively to your Forex trading toolkit.
Good luck and happy trading!
- t.me/finance_solutes
- Website: https://finance-solutes.com
- Hotline: +1 929 5636 439 ( Hotline )
- 26 Broadway, Suite 934, New York, 10004, US
