
 XM
XM Bybit
Bybit Binance
 Robinhood
 Webull
 IC Markets
 Pepperstone
 OKX
OKX Vantage
 VT Markets
 BingX
BingX Gate.io
 Kucoin
 MEXC
MEXC Exness
 Bitget
I get this question quite often – Why do you use moving averages (MAs) as dynamic support and resistance levels? After all, if you’re trading price action, why would you need them? They seem pretty useless. My answer has two parts:
- I use moving averages for more purposes than just dynamic support and resistance.
- Because they work!
In this lesson, I will cover what moving averages are and how to use them. I will also explain why they work and what to look out for. Like all lessons on this website, certain conditions must be met for them to work effectively.
That is, moving averages are only useful when other confluence factors support any given trade setup. But before we delve into the usefulness of moving averages, let’s first understand what they are.
1. MA LINES AND SUPPORT/RESISTANCE
Support and resistance are perhaps some of the most commonly used terms in trading. And each trader may have their own definition of these two levels. However, it is certain that all these individual perspectives share some common points. Support is a price level/zone where the price drops multiple times but is unable to break through for a certain period. Conversely, resistance is a price level/zone where the price rises and, upon reaching that level, turns down and is unable to break through for a certain period.
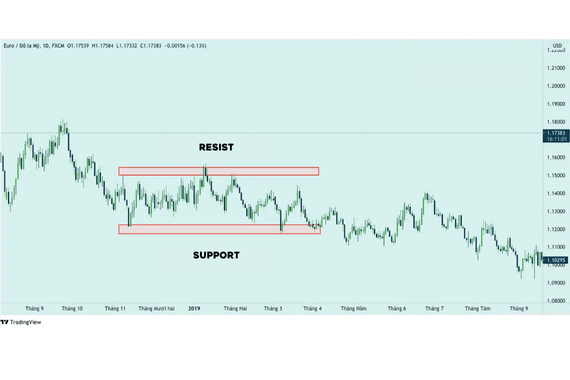
As mentioned in previous posts, support and resistance are not always horizontal lines or zones; they can slope upward or downward depending on the market trend. Theoretically, support is the level where the buyers’ strength is sufficient to defend the price, preventing it from falling further. Conversely, resistance is the level where sellers have enough power to prevent the price from rising further. The moving average (MA) is a trend indicator. It is considered a simple yet effective technical indicator. The MA is calculated based on the closing prices of a given time period by averaging these values. The two most commonly used types of moving averages are the EMA (Exponential Moving Average) and the SMA (Simple Moving Average). Below is an example of a 9-period MA chart:
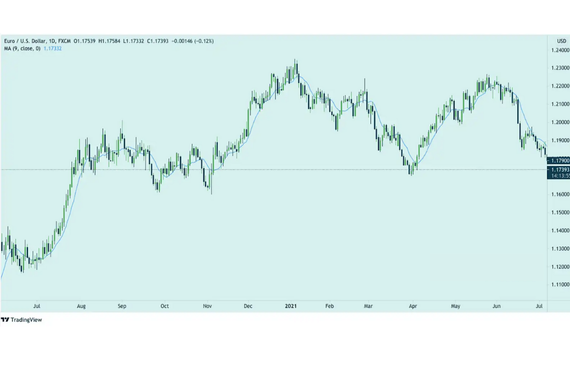
1.1. What is a Moving Average?
A moving average serves as a smoothing indicator. It does this by representing past price action over a specific period as a line. There are two basic and most common types of moving averages:
- Simple Moving Average (SMA)
- Exponential Moving Average (EMA)
At this point, I can grasp all the technical details about the differences. But you only need to know that the exponential moving average places more weight on recent price levels. Therefore, the exponential moving average is considered to react faster and is “more sensitive” than the simple moving average.
Both simple and exponential moving averages work in the same way. They both represent past price action over a specific period as a plotted line.
For example, a 50-period simple moving average on a daily chart uses price action from the past 50 days. This creates a smoother average of the price over the 50-day period.
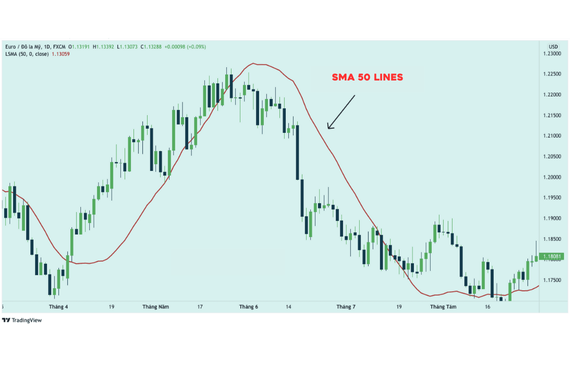
The 50-period simple moving average on the chart represents the past 50 days. Therefore, it represents the last 50 days’ price action. If this were an hourly chart, the moving average would represent the past 50 hours.
One final thing about the moving average indicator is that it is a lagging (slow) indicator. In fact, all indicators are lagging indicators. The only thing that isn’t lagging is natural price action. And this is exactly why I use it.
At any level, moving averages have a delay. This is simply because they are based on past price action. But that’s okay because at Tradafx, we only use them as an additional confluence factor for our price action trading strategies.
1.2. Types of Moving Averages
There is no “one-size-fits-all” way to use moving averages. Every trader seems to have their own combination of moving averages that work for them. Personally, I use the 10 and 20 exponential moving averages. I find them to work best with my price action trading approach.
Knowing how to use moving averages and why they are effective is essential when deciding to use them (if at all). So, let’s take a closer look!
1.3. Which MA is the Best?
This is probably the most common question when traders get to know moving averages. If you load multiple moving averages on a chart at once, such as the MA 9, MA 50, and MA 100, you may notice that sometimes the price bounces off the MA 9, other times off the MA 50, and occasionally off the MA 100.
So, which moving average should we use? Traders can consider the following aspects and make their own decisions:
- The shorter your trading timeframe, the shorter the moving average you should look at.
- The stronger the market trend, the shorter the moving average from which the price may bounce.
- The longer the moving average, the more reliable it is, but it will have a certain lag.
2. HOW TO USE MOVING AVERAGES
There are two basic ways to use moving averages:
- To help identify a potential change in trend; to assess the strength of the current trend.
- To use moving averages as support and resistance.
First, let’s look at how these moving averages can help with trends.
2.1. Moving Averages and Trends
Moving averages can certainly help signal a potential change in trend as well as assess the strength of the current trend. However, there are trendlines where moving averages might not be very useful.
Let’s take the chart below as an example.
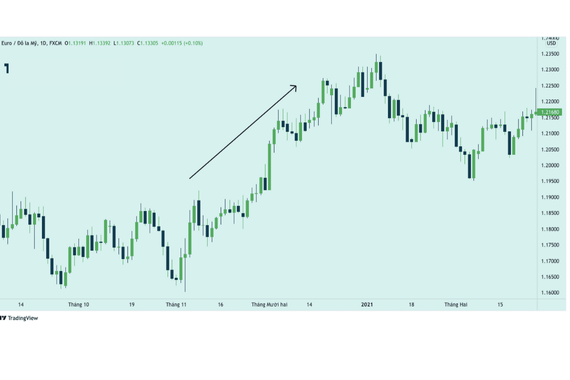
EUR/USD is in such a strong uptrend that we don’t really need moving averages to indicate this is a strong trend. Now, let’s look at a chart where moving averages can help quickly assess the strength of the trend as well as potential changes in the trend.
Moving averages can be a great support tool. They help you quickly detect potential trend changes and assess the strength of the trend. But they should not be used as the sole determining factor.
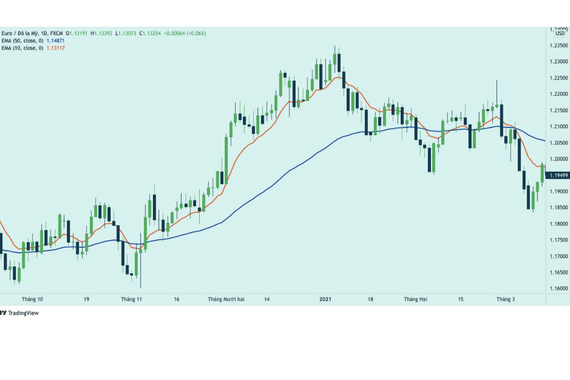
On the chart above, notice how EUR/USD breaks out of the random oscillation phase and forms a strong trend. This combination of moving averages only works in a trending market. If the market is ranging or moving randomly, these moving averages will be of little to no help. That being said, a trending market is ideal when trading price action.
Now that we understand how moving averages can help with trends, let’s look at how they function as dynamic support and resistance.
2.2. Dynamic Support and Resistance
We all know about support and resistance as horizontal or trendline-based levels. But dynamic support and resistance is a different concept.
Before we continue, it’s important to understand that dynamic support and resistance are not as strong or reliable as horizontal or trendline-based support and resistance. However, they do have their uses.
Dynamic support and resistance can be found when the moving average crosses the current price. Let’s take a look at the daily chart of EUR/USD. This time, we will look for dynamic support and resistance provided by the 10 and 20 exponential moving averages.
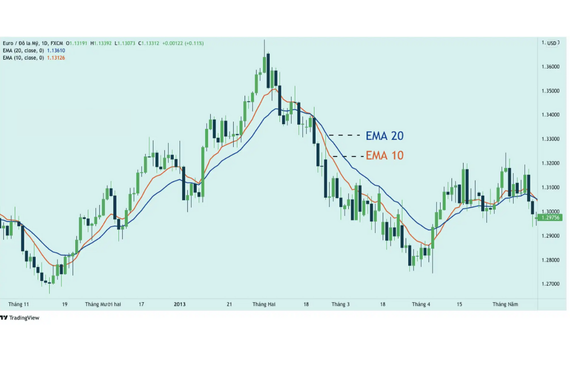
Notice how the 10 and 20 exponential moving averages appear to provide support and resistance. These two moving averages can serve as strong support, but they should only be used in conjunction with the appropriate confluence factors.
(EMA in the chart above stands for Exponential Moving Average)
3. USING MA AS DYNAMIC SUPPORT AND RESISTANCE
Everyone knows the importance of horizontal support and resistance levels and why we draw trendlines. So how can moving averages be applied when considered as dynamic support and resistance levels? Let’s explore this!
3.1. Common MA Strategy
You can use moving averages in many ways. Traders often check if the price is oscillating above or below the moving average, then decide whether the bulls or bears are in control (especially in larger timeframes). Moving averages can certainly help signal potential trend changes and assess the strength or weakness of the current trend.
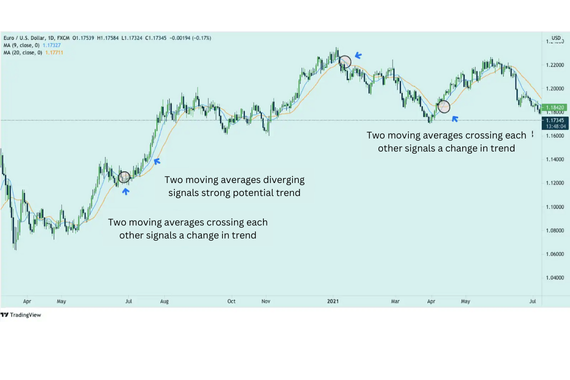
Let’s look at the example in the EUR/USD chart above. Moving averages can be a great help in quickly identifying potential trend changes and assessing the strength of a trend. However, this doesn’t mean they should be considered the deciding factor. So how do they function as dynamic support and resistance levels? The examples below will all use the 10 and 20 EMA lines.
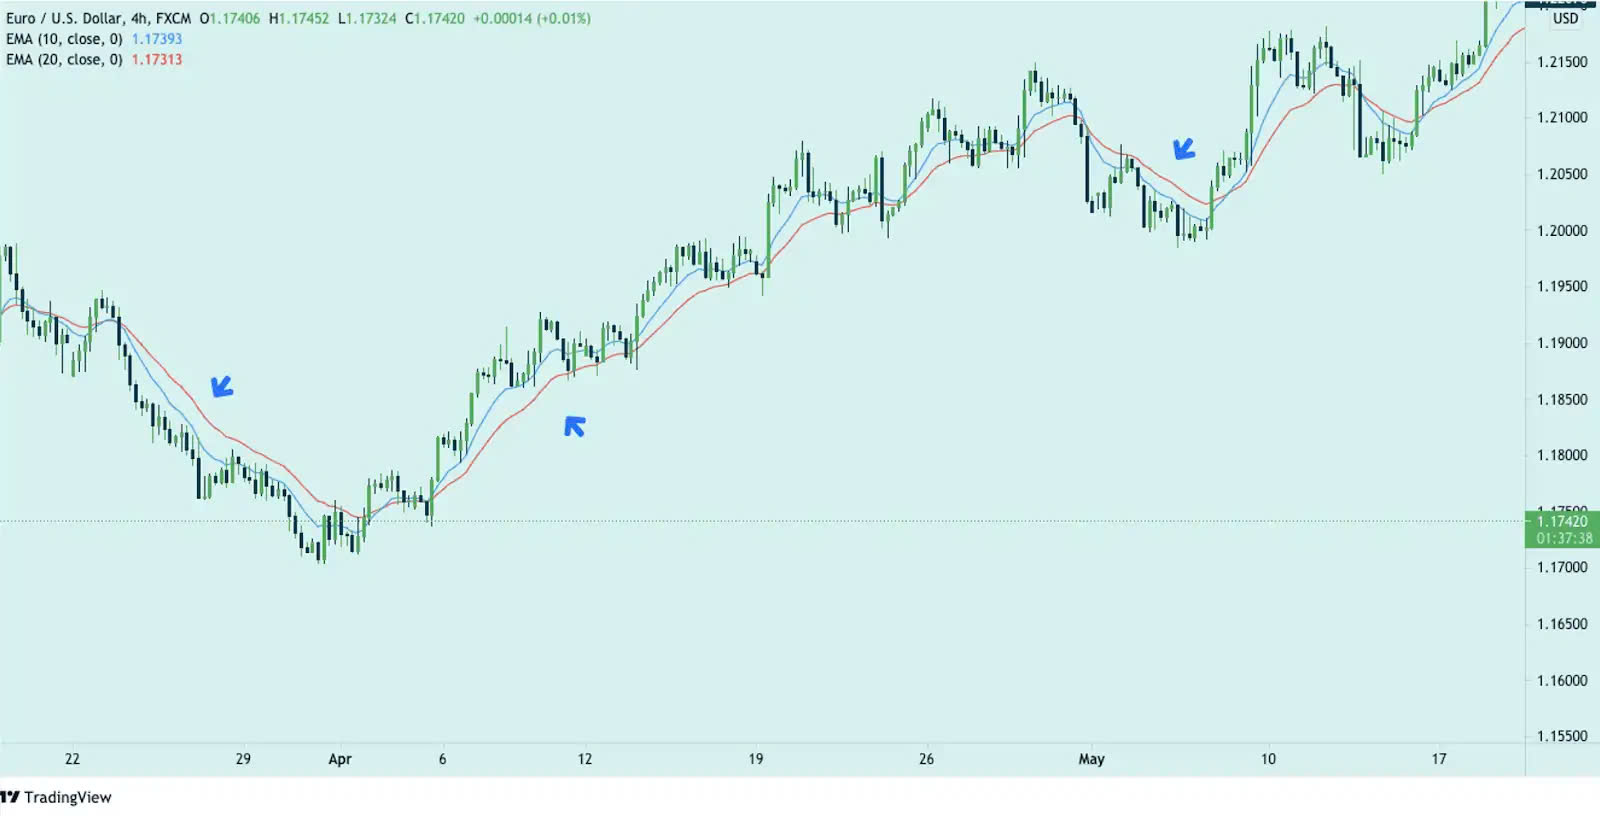
As seen in the example above, the 10 and 20 EMAs serve as dynamic support and resistance levels. The price respects these areas, and almost every time it touches these levels, it bounces back. While it may briefly surpass the EMA by a few pips, it generally continues in the previous trend. When the price approaches the moving average, traders will carefully consider whether it will bounce back or break through this resistance level, just like any other support or resistance level. When the price moves further away from its moving average, the trade becomes riskier than ever (because the moving average is still a mean level, and there’s a theory that price will eventually revert to its average value). Some traders take advantage of golden cross moving average crossovers to find entry and exit points. The area created by the moving averages is considered a dynamic support/resistance zone.
3.2. Retest – Avoid False Breakouts
It’s natural that support and resistance levels cannot hold forever. After a certain period, the price will break through these levels. Moving averages are no exception; they too will be broken, just like any other support or resistance level.
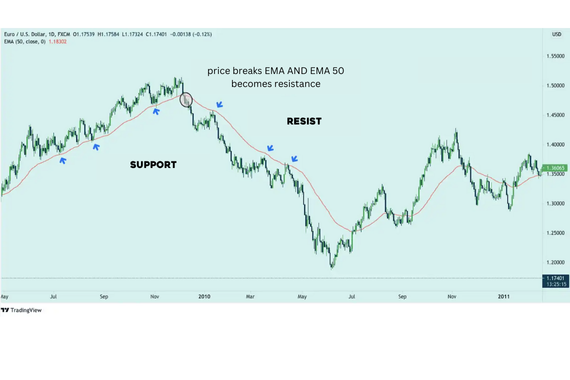
In the example chart above, we can see that the 50 EMA has served as a strong support level for quite some time. Whenever the price touches the 50 EMA, it tends to bounce back. However, as highlighted in the chart, eventually the price breaks through the 50 EMA. And not every time the price breaks the moving average will it follow a new trend immediately, as in the example. Sometimes we may encounter a false breakout, where the price breaks the 50 EMA but then returns to the previous trend. To avoid false breakouts, we should wait for a retracement and check the 50 EMA. At that point, a reversal signal becomes more reliable.
4. WHY DOES DYNAMIC SUPPORT AND RESISTANCE WORK?
The reasons why dynamic support and resistance work are very similar to why price action works. It has to do with the fact that thousands of traders are using moving averages. Among the moving averages traders use, there are only a few popular ones. I’d guess that 90% of traders using moving averages are using one of the following five periods:
- 10
- 20
- 50
- 100
- 200
There are also other variations, but in my experience, the majority of traders use one of these variations. So what happens when 90% of traders use one of these common moving averages?
The truth is, nothing.
But what happens when 90% of those using moving averages treat them as support/resistance? I think you know the answer…
Price tends to respect these moving averages in some way, right? It’s like a “self-fulfilling prophecy.” If enough people look at and analyze the same thing and all expect the same outcome, it’s more likely to happen. This happens because many traders (doubtful or not) use these listed moving averages as “core” levels. They don’t wait for other confluence factors to buy or sell.
Like anything else in forex trading, nothing is guaranteed. These moving averages are just one of the tools we can use. The same goes for price action at key levels, inside bar trading strategies, etc. They are just individual tools.
We cannot build a trading strategy based on one or two individual tools. What we need is a full set of tools.
I hope this article has helped you understand more about how moving averages work, as well as the usefulness of combining them with price action trading. My goal was not only to demonstrate the usefulness of using moving averages as dynamic support and resistance but also to highlight their limitations.
5. SUMMARY
Trading with moving averages as dynamic support and resistance is not that difficult. However, to achieve high profits from this strategy, we need a proper trading and risk management strategy. One of the great things about this strategy is that we can use moving averages as dynamic support and resistance levels without focusing too much on drawing horizontal moving averages. But like any strategy, this one has its downsides. And, of course, it’s not perfect. So, consider them as one tool in your trading toolbox that you can apply and use to increase your chances of success in trading. Best of luck!
- t.me/finance_solutes
- Website: https://finance-solutes.com
- Hotline: +1 929 5636 439 ( Hotline )
- 26 Broadway, Suite 934, New York, 10004, US
