
 XM
XM Bybit
Bybit Binance
 Robinhood
 Webull
 IC Markets
 Pepperstone
 OKX
OKX Vantage
 VT Markets
 BingX
BingX Gate.io
 Kucoin
 MEXC
MEXC Exness
 Bitget
A method that has garnered significant attention from traders is using moving averages (MAs) as dynamic support and resistance levels. What is this method? How does it work, and how can you trade with it? Let’s delve into these questions in this article.
I often receive the question: Why do you use moving averages as dynamic support and resistance levels? After all, if you’re trading price action, why do you need them? They seem quite useless.
Here’s my two-part answer:
- I use moving averages for more than just dynamic support and resistance.
- Because they work!
In this lesson, I will explain what moving averages are and how to use them. I will also discuss why they work and what to pay attention to. Like all lessons on this site, certain conditions must be met for them to be effective.
This means moving averages are only useful when other confluence factors support a particular trading setup. But before we explore the usefulness of moving averages, let’s first understand what they are.
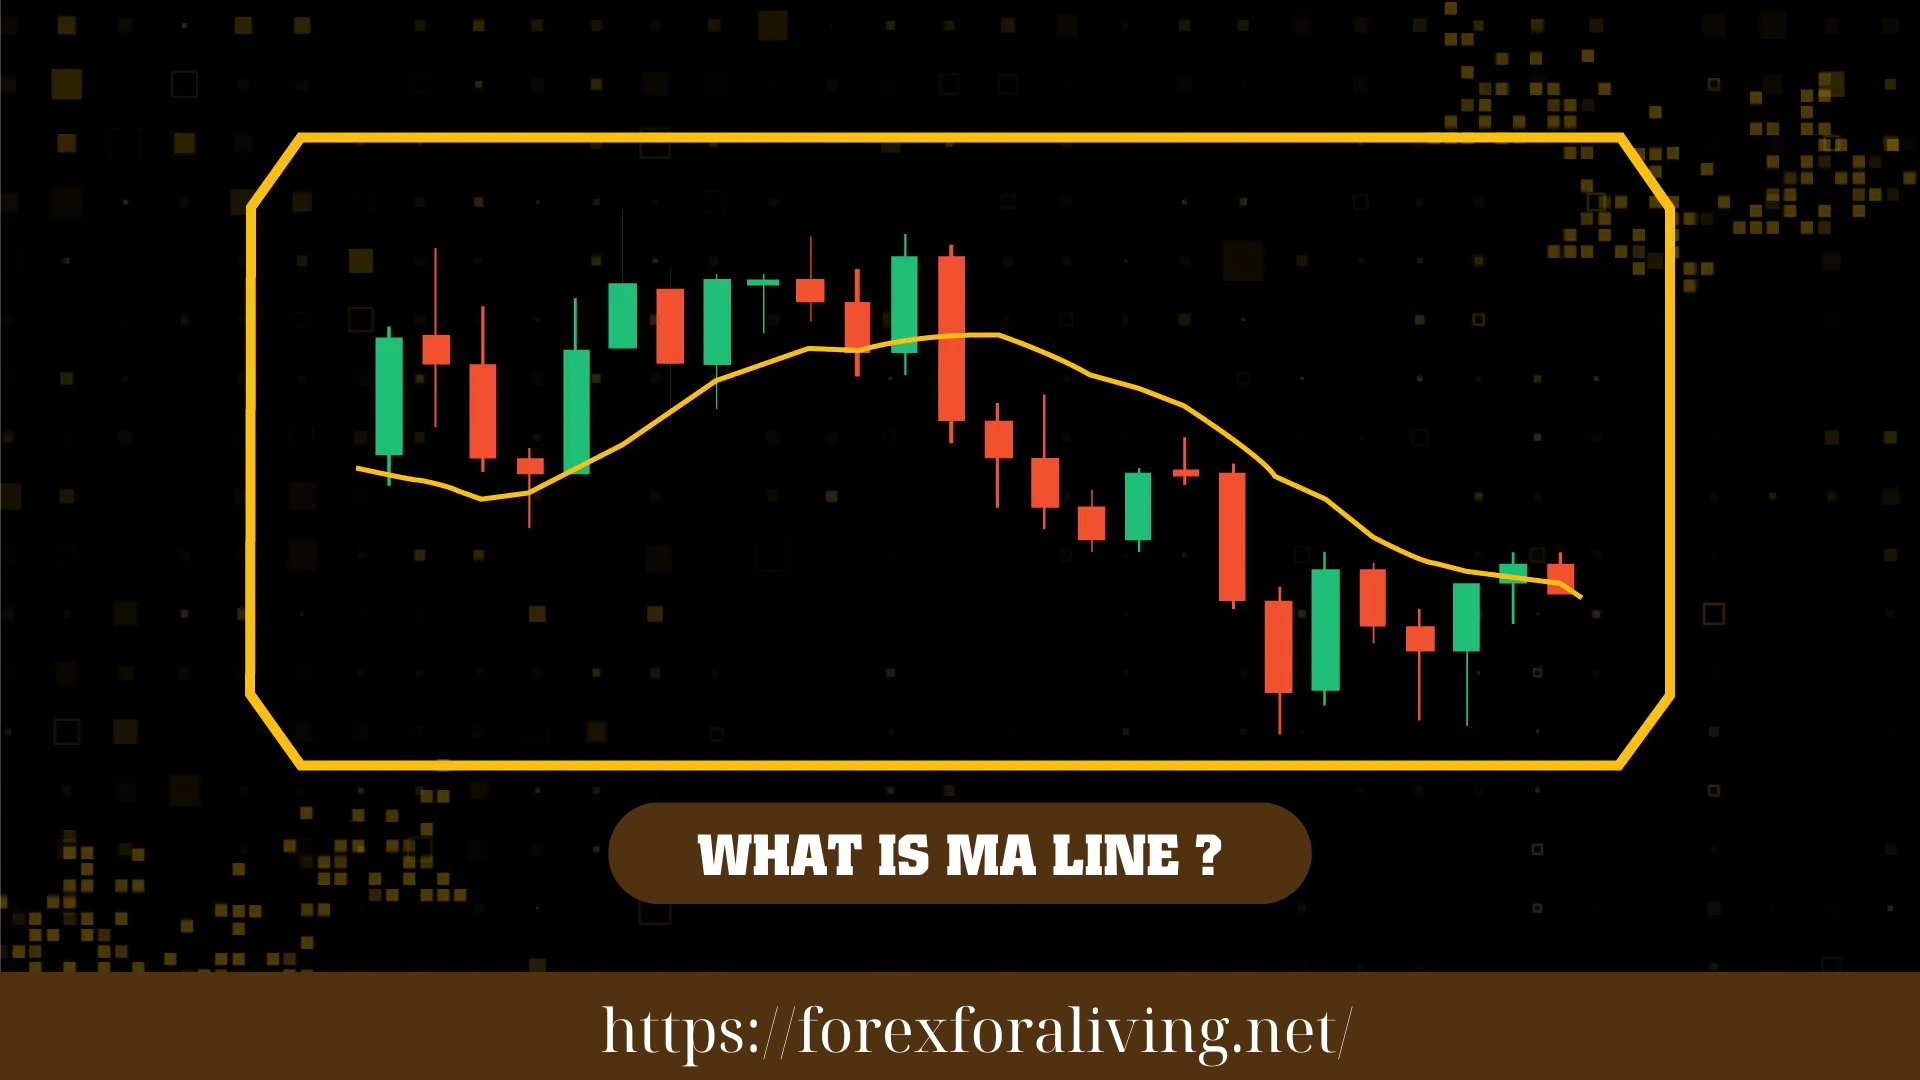
1. Moving Averages and Support/Resistance
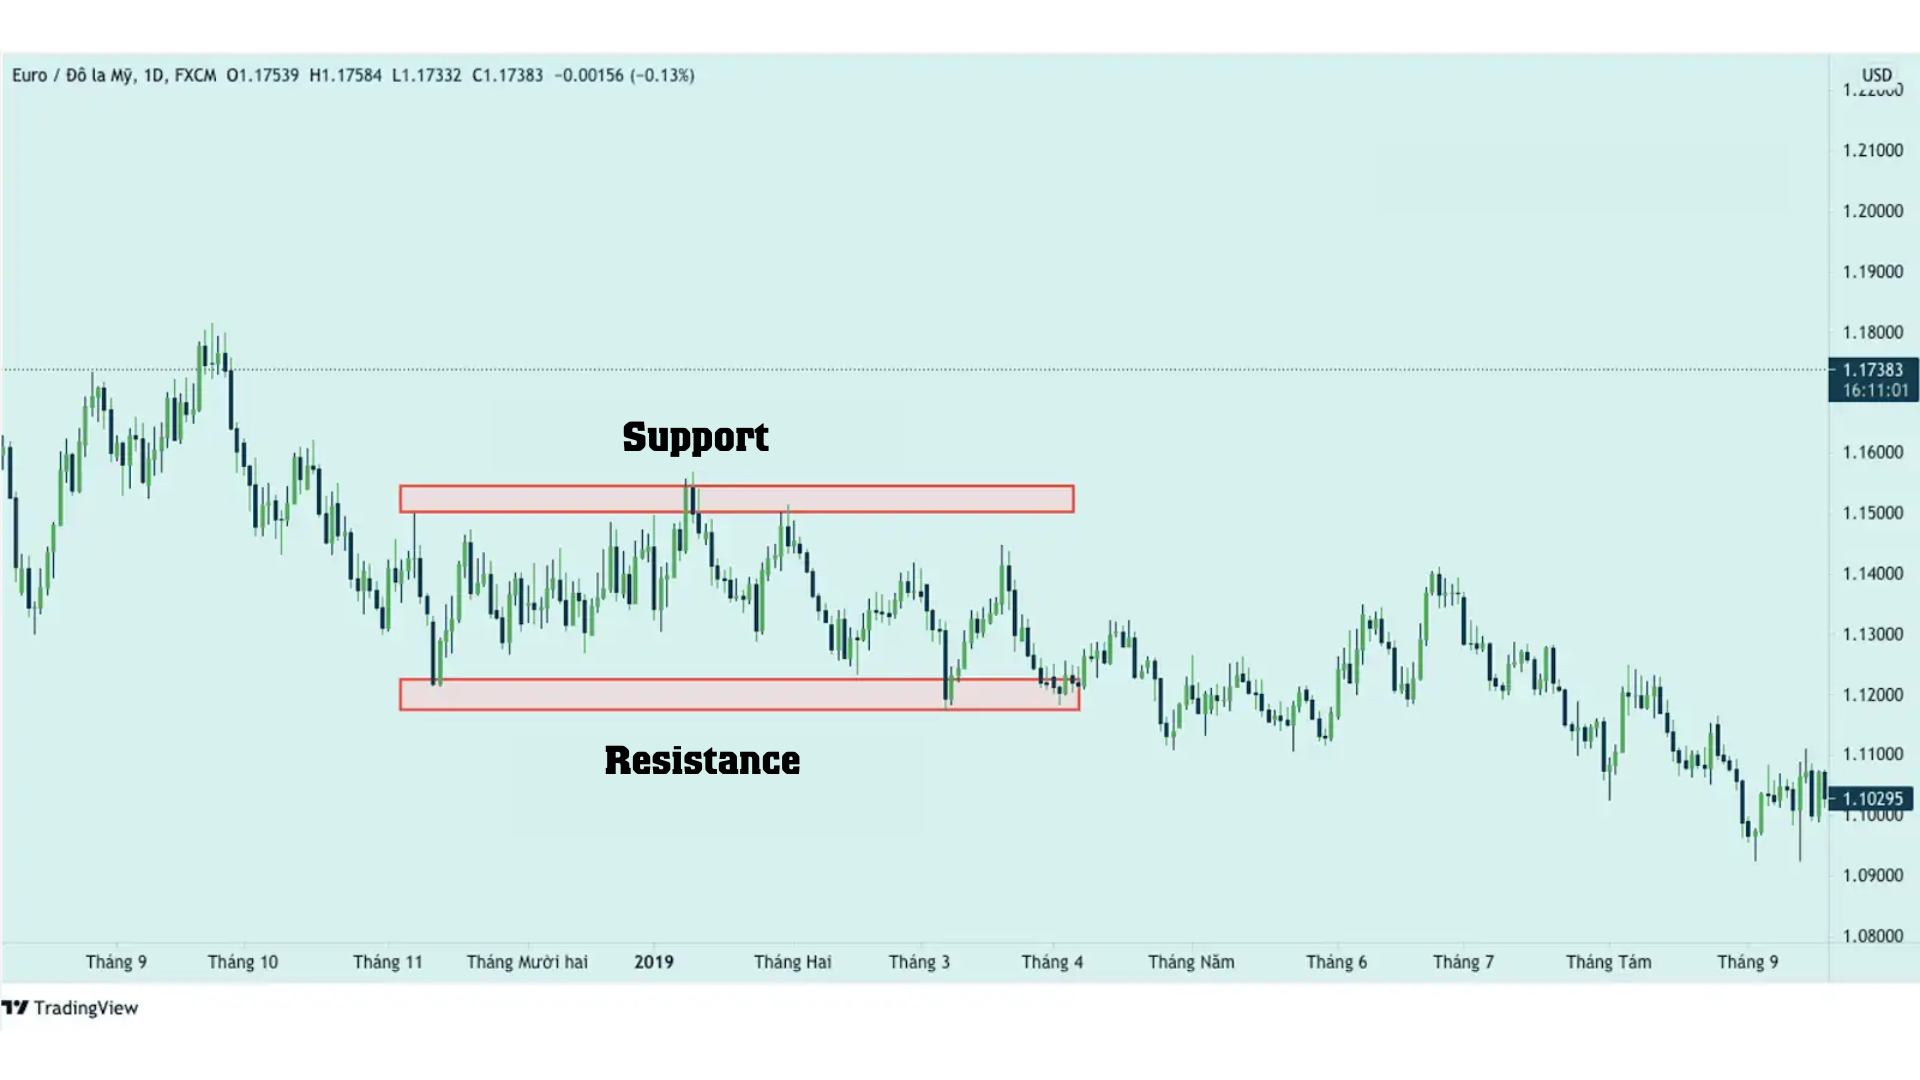
Support and resistance are among the most frequently used terms in trading. Each trader may have their own definitions of these levels, but they generally share some common principles:
- Support is a price level or zone where the price repeatedly drops but cannot break through for a certain period.
- Resistance is a price level or zone where the price rises, touches that level, and then reverses, failing to break through over time.
Moving Averages and Support/Resistance
As discussed in previous lessons, support and resistance are not always horizontal lines or zones. They can slope upward or downward, depending on the market trend.
- Support occurs when buyers have enough strength to prevent the price from falling further.
- Resistance occurs when sellers have enough power to stop the price from rising further.
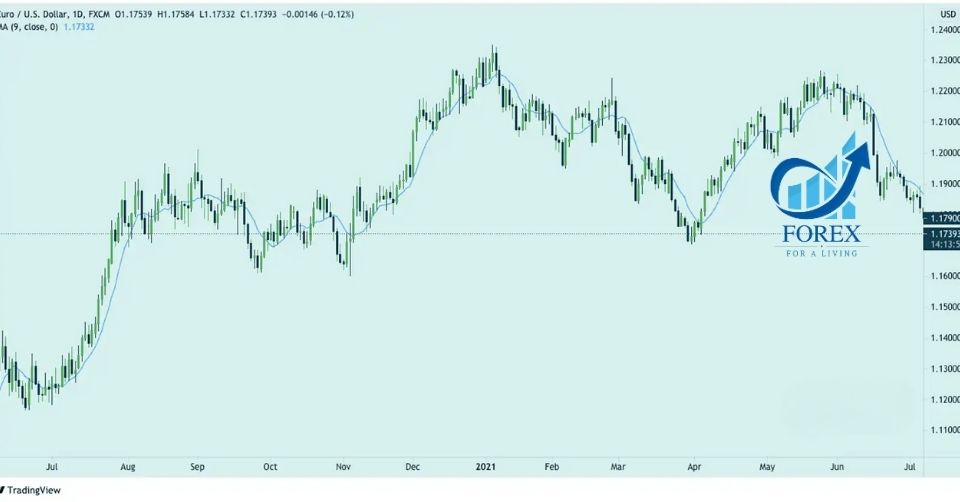
Moving averages (MAs) are trend-following indicators and are considered simple yet effective technical tools. They are calculated by averaging closing prices over a specific time period.
The two most commonly used types of moving averages are:
- EMA (Exponential Moving Average): Assigns more weight to recent data, making it more sensitive to price changes.
- SMA (Simple Moving Average): Assigns equal weight to all data points over the selected period.
Below is an example of a 9-period moving average:
1.1. What is a Moving Average?
A moving average (MA) is a smoothing indicator. It achieves this by representing past price actions over a specific period as a plotted line. There are two main and most commonly used types of moving averages:
- Simple Moving Average (SMA) – Represents an equally weighted average of past prices.
- Exponential Moving Average (EMA) – Places more weight on recent prices, making it more reactive to recent price changes.
At this point, I could delve into all the technical details of their differences. However, the essential takeaway is that the EMA reacts faster to recent price movements, making it more “sensitive” compared to the SMA.
Both the SMA and EMA function similarly:
- They represent past price actions over a specific period as a plotted line.
For example:
- A 50-period simple moving average on a daily chart calculates the average price over the past 50 days. This results in a smoother line representing the average price trend for the 50-day period.
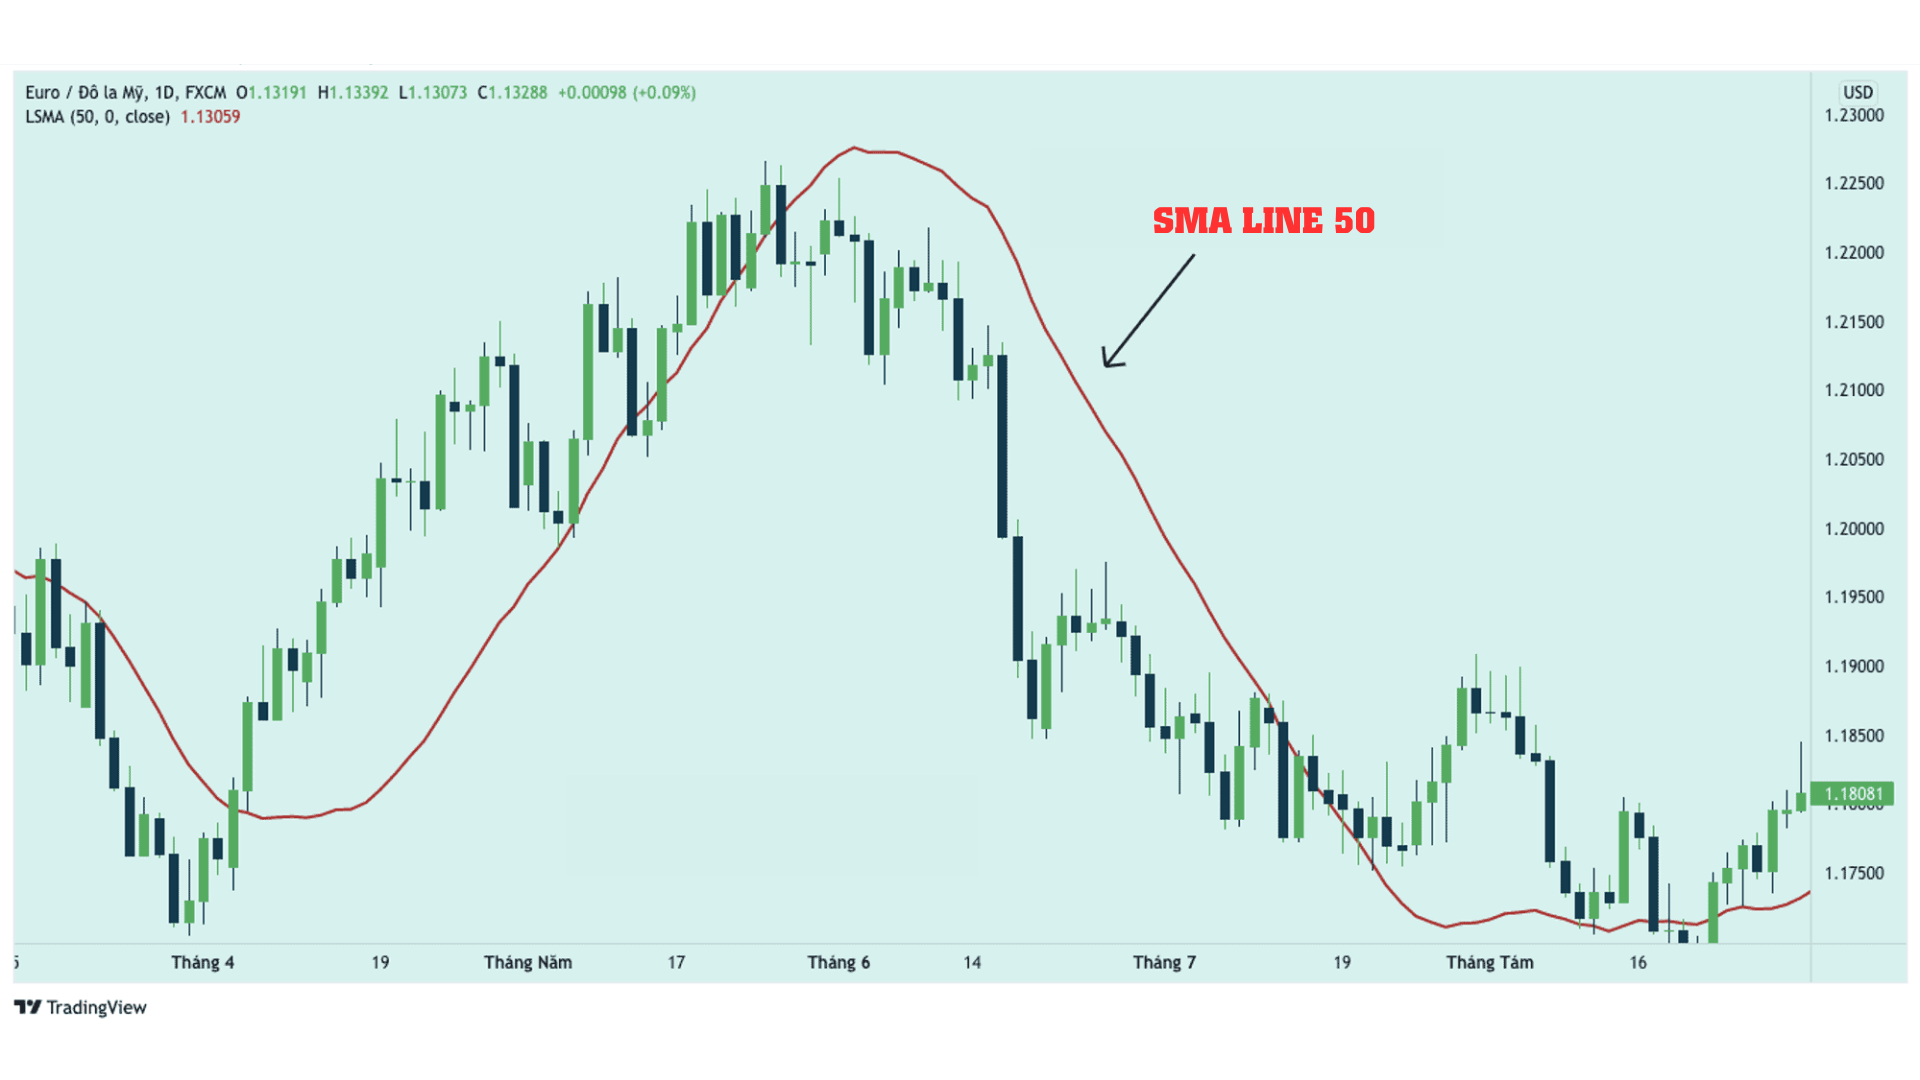
A 50-period simple moving average (SMA) on a daily chart represents the price action of the previous 50 days. On an hourly chart, the same moving average reflects the price action of the last 50 hours.
One crucial aspect of moving averages is that they are lagging indicators. In fact, all technical indicators are lagging because they rely on historical data. The only real-time, non-lagging metric is raw price action itself. This is precisely why I integrate moving averages into my strategy — not as a primary tool but as a supporting element.
Although moving averages inherently lag due to their dependence on historical price data, this limitation is acceptable. At TradaFX, we use them as an additional confluence factor alongside price action trading strategies.
1.2. Types of Moving Averages
There is no definitive “right” way to use moving averages. Every trader seems to develop their own combination that suits their trading style. Personally, I favor the 10-period and 20-period exponential moving averages (EMAs). These work best for my price action trading approach.
Understanding how to use moving averages and why they work is crucial when deciding to incorporate them (if at all). Let’s dive deeper!
1.3. Which Moving Average Is the Best?
This question is perhaps the most frequently asked by traders learning about moving averages. If you were to display multiple moving averages on a chart — such as a 9-period, 50-period, and 100-period MA — you might notice that the price sometimes bounces off the 9-period, other times the 50-period, and occasionally the 100-period moving average.
This variability highlights that no single moving average fits all scenarios. Instead, the key lies in understanding how different MAs interact with the price and utilizing them as part of a broader trading strategy.
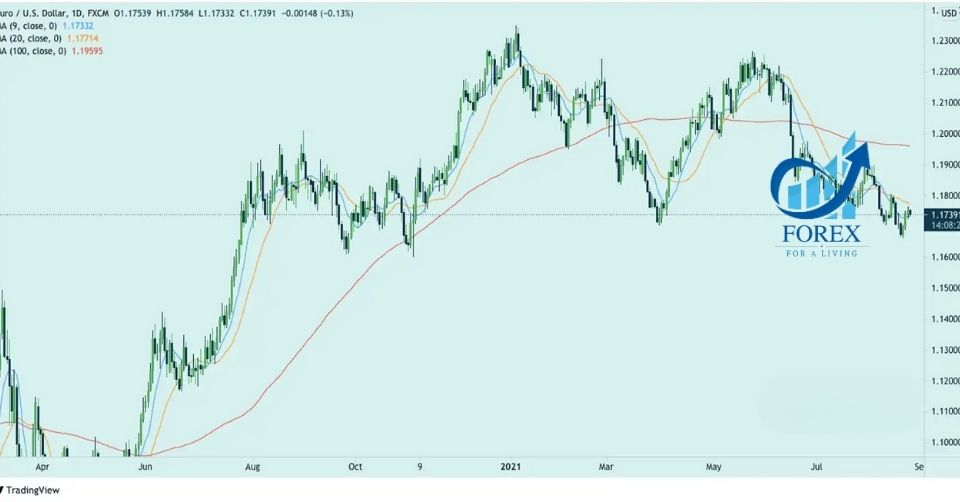
Which Moving Average Should We Use?
Traders can consider the following factors and decide for themselves:
- The shorter your trading timeframe, the shorter the moving average you should consider.
- The stronger the market trend, the shorter the moving average cycle that the price tends to bounce off.
- The longer the moving average, the more reliable it is, but it will have a certain degree of lag.
2. How to Use Moving Averages
There are two basic ways to use moving averages:
- To help identify potential trend changes and determine the strength of the current trend.
- To use moving averages as dynamic support and resistance levels.
Let’s first explore how moving averages can assist with trends.
2.1. Moving Averages and Trends
Moving averages can undoubtedly help signal potential trend changes and gauge the strength of the current trend. However, there are certain trend lines where moving averages may not be particularly helpful.
Take the chart below as an example.
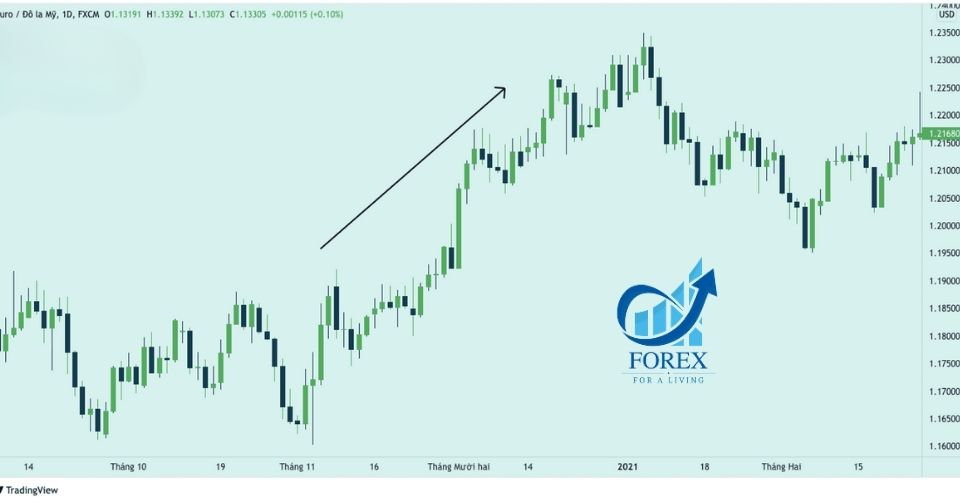
The EUR/USD is currently in such a strong uptrend that we don’t necessarily need moving averages to confirm this strength. Now, let’s look at a chart where moving averages can help quickly identify the strength of a trend and potential changes within the trend.
Moving averages can be a fantastic tool for quickly spotting potential trend changes and gauging the strength of a trend. However, they should not be used as the sole decision-making factor.
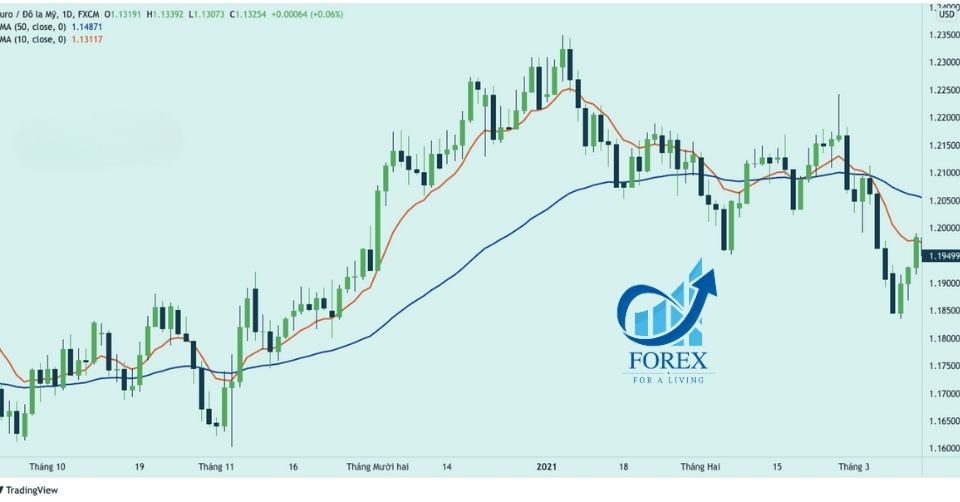
In the chart above, notice how EUR/USD transitions from random fluctuations to a robust trend. This combination of moving averages works effectively in trending markets. However, if the market is range-bound or moving randomly, these moving averages will provide little to no assistance.
It’s important to note that trending markets are ideal for price action trading.
Now that we understand how moving averages can assist with trends, let’s explore how they function as dynamic support and resistance.
2.2. Dynamic Support and Resistance
We are all familiar with support and resistance in the form of horizontal lines or diagonal trendlines. However, dynamic support and resistance is a different concept.
Before proceeding, it’s essential to know that dynamic support and resistance are not as strong or consistent as horizontal or diagonal support and resistance levels. That being said, they still have their uses.
Dynamic support and resistance can be observed when moving averages intersect with the current price. Let’s examine a daily chart of EUR/USD. This time, we will focus on dynamic support and resistance provided by the 10- and 20-period exponential moving averages (EMAs).
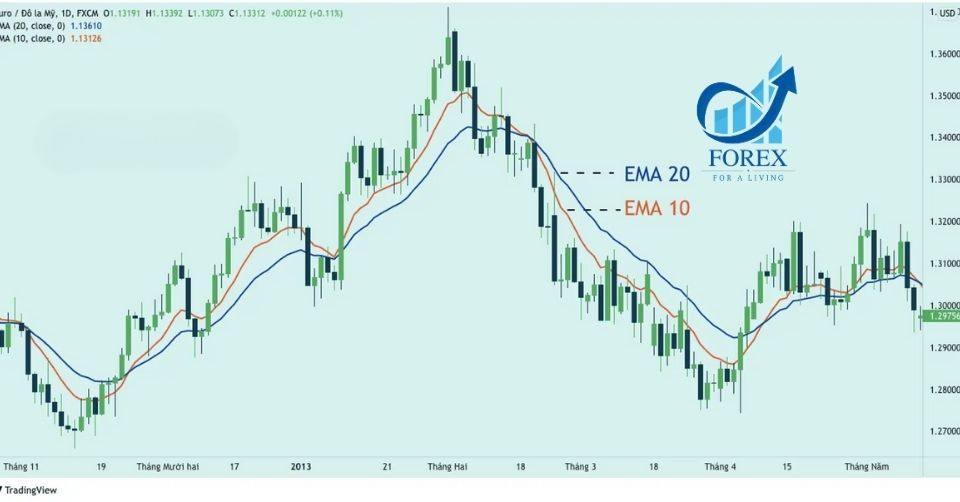
Notice how the 10- and 20-period exponential moving averages (EMAs) seem to provide dynamic support and resistance. These moving averages can act as strong support levels but should only be used in combination with proper confluence factors.
(The abbreviation EMA in the chart stands for Exponential Moving Average.)
3. Using Moving Averages as Dynamic Support and Resistance
We all understand the importance of horizontal support and resistance levels and why trendlines are drawn on charts. So how can moving averages be applied as dynamic support and resistance? Let’s explore this concept further.
3.1. Common MA Strategy
You can use moving averages in several ways. Traders often check whether the price is moving above or below the moving average and then determine whether the bulls or bears are in control (especially in higher timeframes).
Moving averages can undoubtedly help signal potential trend changes and assess the strength of the current trend.
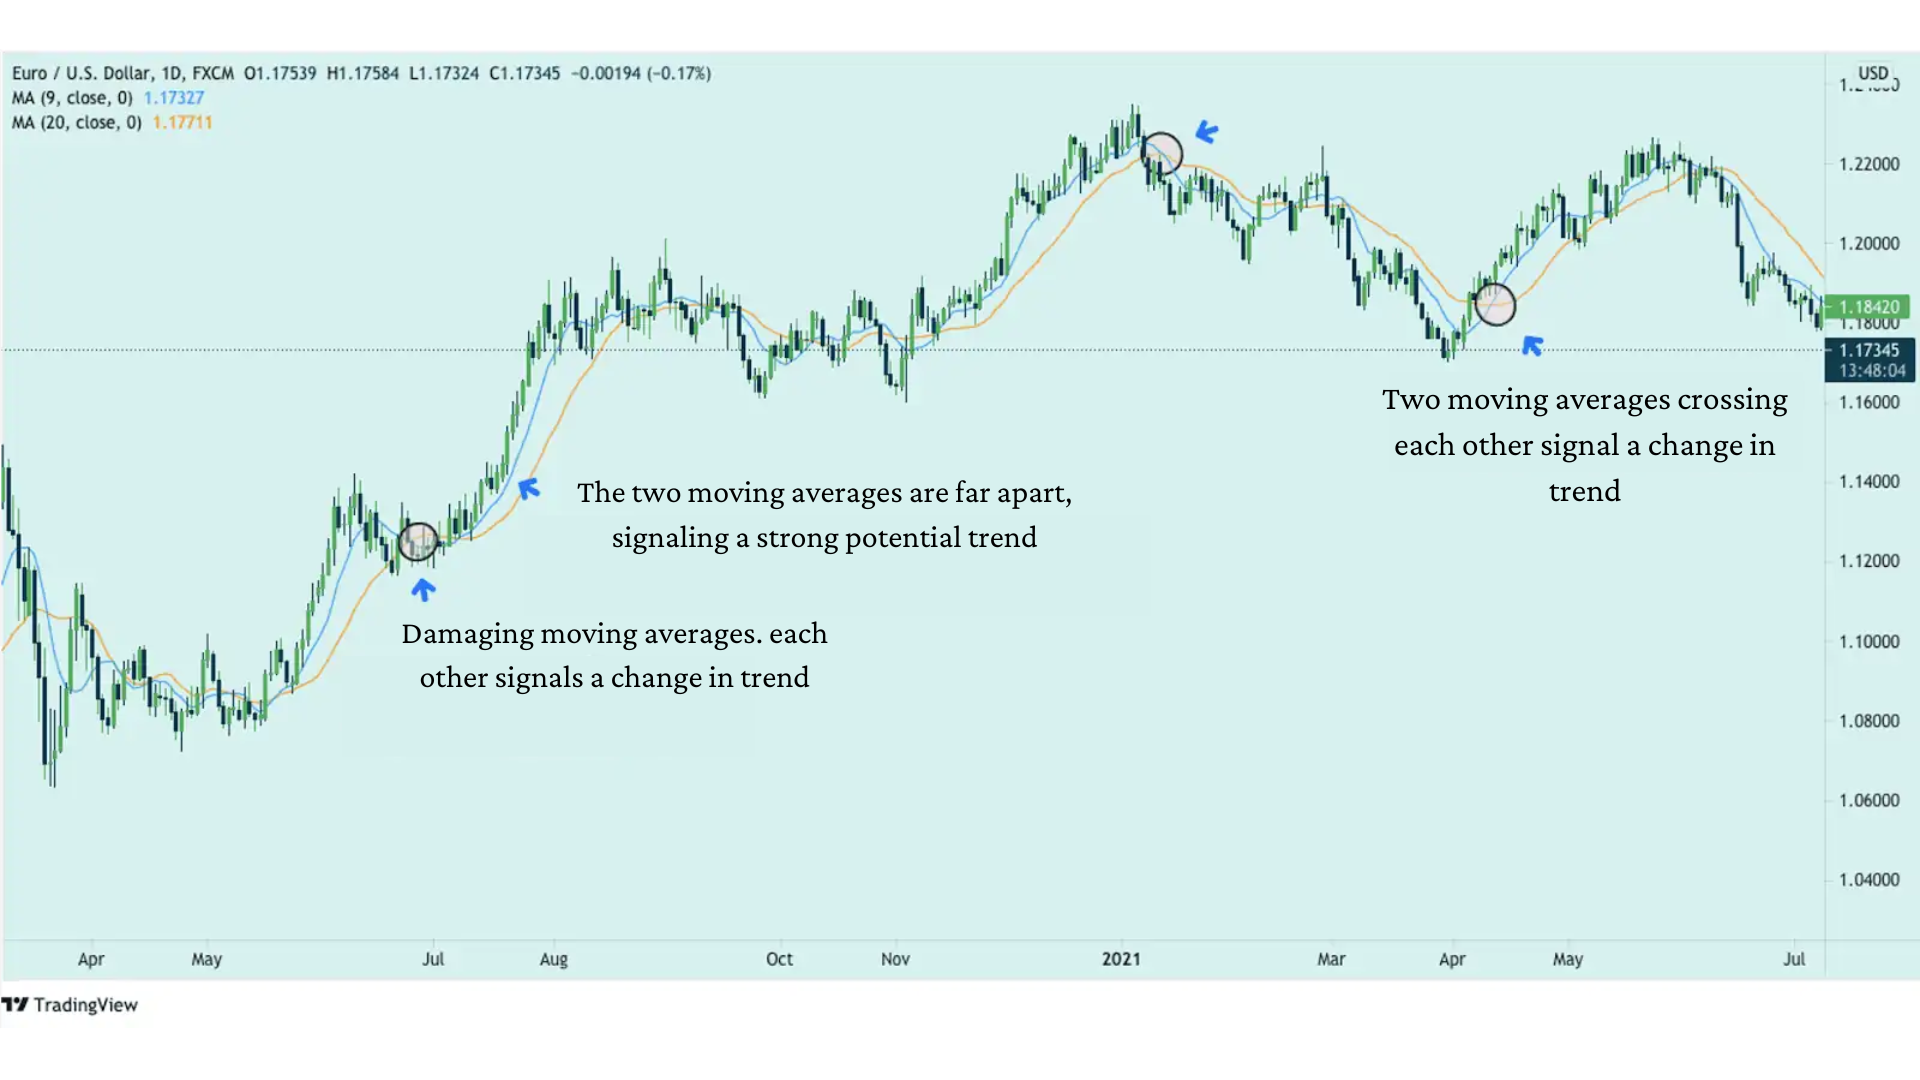
In the EUR/USD chart example above, moving averages can be a great tool to quickly identify potential trend changes and the strength of a trend. However, this doesn’t mean they should be relied upon as the sole deciding factor. How do they function as dynamic support and resistance levels? Let’s explore using the 10- and 20-period EMAs in the examples below.
As seen in the example above, the 10- and 20-period EMAs act as dynamic support and resistance levels. The price respects these levels, often bouncing back each time it approaches. While it may breach the EMAs by a few pips, the price typically returns to its prior trend shortly after.
When the price nears the moving average, traders pay close attention to determine whether it will bounce back or break through, much like with any other support and resistance levels.
As the price moves farther away from its moving average, trading becomes riskier than ever (since a moving average represents an average value, and there’s a theory suggesting that the price will eventually return to its mean).
Some traders use golden crossovers of moving averages to find entry and exit points. The area formed by moving averages is often considered a zone of support or resistance.
3.2. Retests – Avoiding False Breakouts
It’s natural that no support or resistance level can hold indefinitely. After some time, the price will eventually break these levels. Moving averages are no exception and will also be breached like any other support or resistance zone.
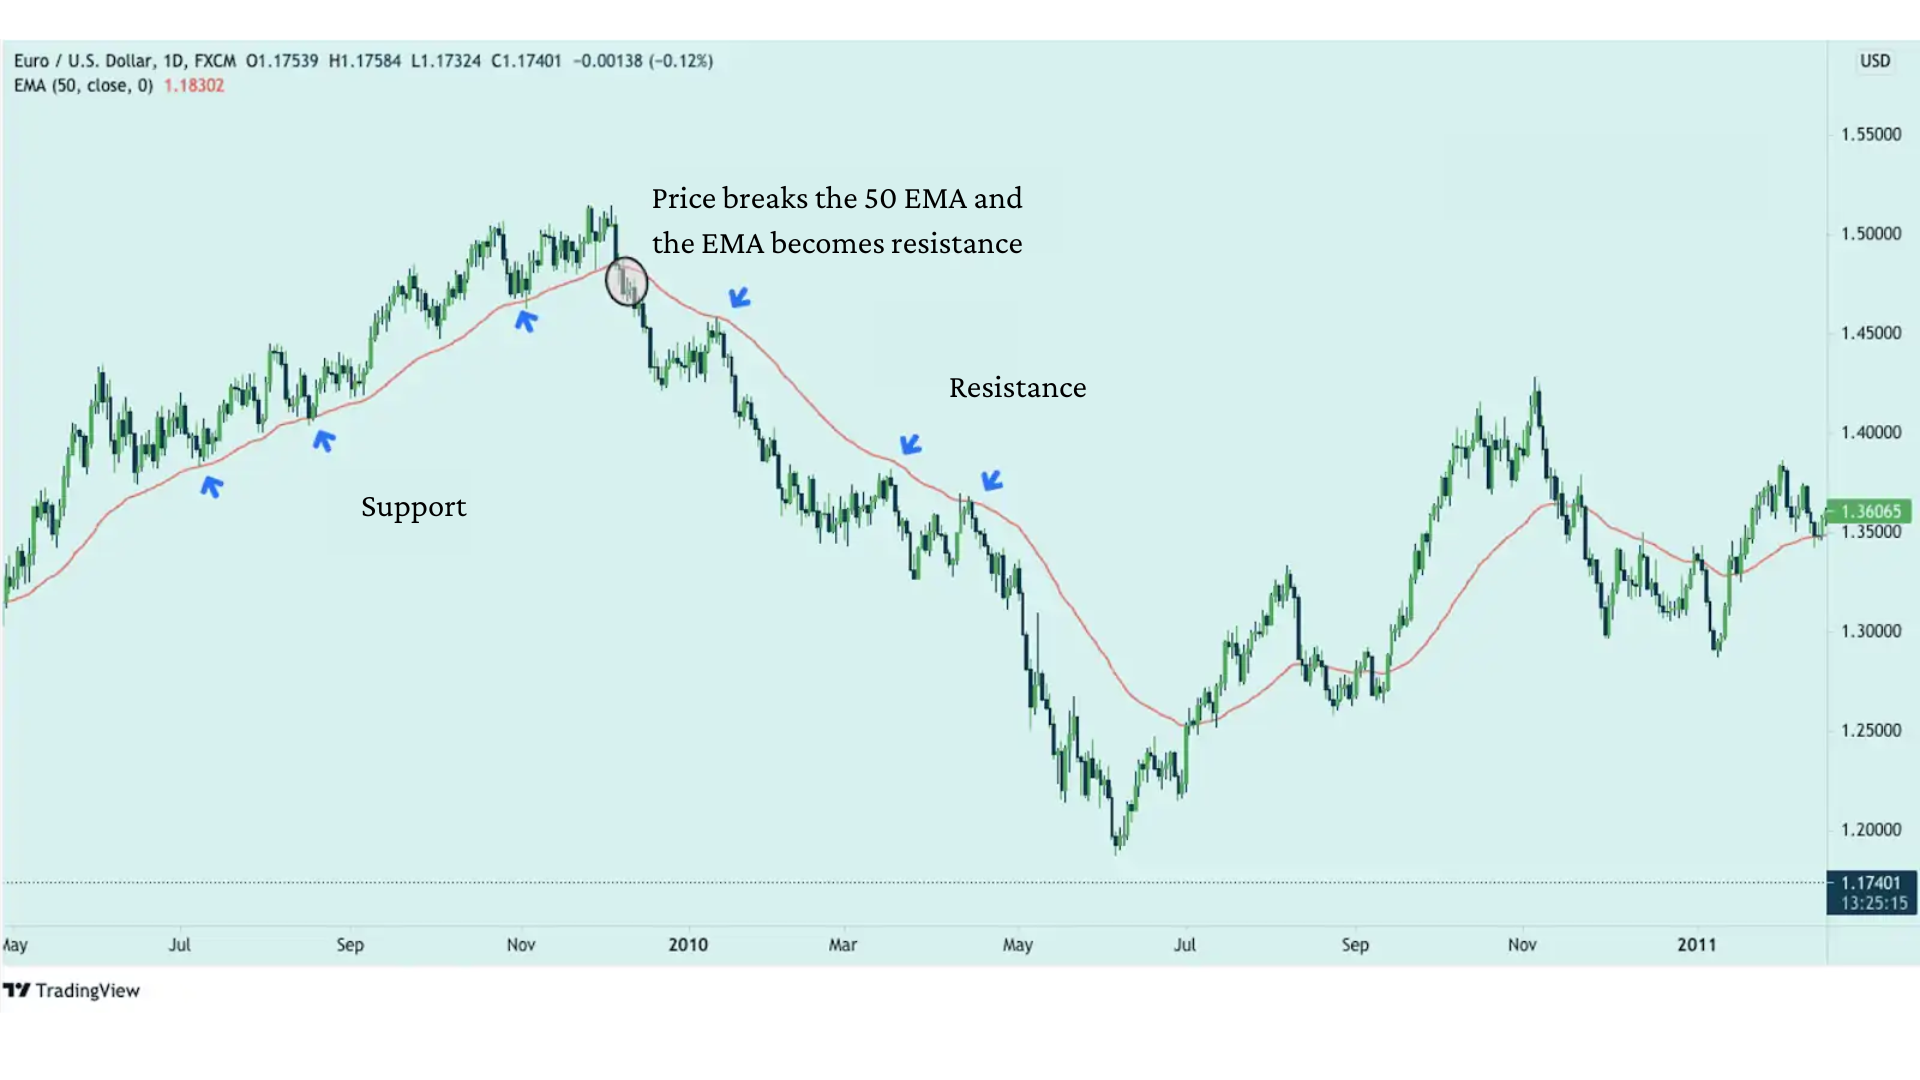
3.3 Example in EUR/USD Chart
In the example chart above, the 50-period EMA has maintained itself as a strong support level for a considerable period. Whenever the price touches the 50 EMA, it tends to bounce back. However, as circled in the chart, the price eventually broke the 50 EMA. It’s important to note that price doesn’t always break the moving average and immediately follow a new trend as shown in the example. Sometimes, we may encounter a false breakout, where the price breaks the EMA and then returns to the previous trend. To avoid this situation, we wait for a price retracement and test the 50 EMA again. At that point, the trend reversal signal becomes more reliable.
4. Why Are Dynamic Support and Resistance Effective?
The reasons why dynamic support and resistance are effective are similar to why price action works. It’s tied to the fact that thousands of traders use moving averages. Among the moving averages traders use, only a few are commonly used. I would guess that 90% of traders using moving averages rely on one of these five periods:
- 10
- 20
- 50
- 100
- 200
While there are other variations, in my experience, most traders rely on one of these. So, what happens when 90% of traders are using one of these popular moving averages?
The truth is, nothing really happens on its own.
But what happens when 90% of people using moving averages treat them as support/resistance? I think you know the answer…
The price often respects these moving averages in some way, right? It’s like a “self-fulfilling prophecy.” If enough people are looking at the same thing and analyzing it the same way, expecting the same result, the chances of that result happening increase. This happens because many traders (whether they doubt it or not) treat the listed moving averages as the “core.” They don’t wait for other confluence factors to make their buy or sell decisions.
5. Summary
Trading with moving averages as dynamic support and resistance isn’t too difficult. However, to achieve high profitability with this strategy, you need to have an appropriate trade and risk management strategy. One of the best things about this strategy is that we can use moving averages as dynamic support and resistance levels without worrying too much about drawing horizontal support/resistance lines. But, like any other strategy, it has its drawbacks. It’s not perfect. Therefore, consider using them as just one tool in your trading toolkit, which you can apply to increase your chances of success.
Good luck with your trading!
- t.me/finance_solutes
- Website: https://finance-solutes.com
- Hotline: +1 929 5636 439 ( Hotline )
- 26 Broadway, Suite 934, New York, 10004, US
