
 XM
XM Bybit
Bybit Binance
 Robinhood
 Webull
 IC Markets
 Pepperstone
 OKX
OKX Vantage
 VT Markets
 BingX
BingX Gate.io
 Kucoin
 MEXC
MEXC Exness
 Bitget
The Relative Strength Index (RSI) is a popular indicator developed by technical analyst J. Welles Wilder, designed to help traders assess the strength of the current market.
The RSI indicator is similar to the Stochastic indicator in that it identifies overbought and oversold conditions in the market. It also has a value range from 0 to 100. Typically, values below 30 indicate an oversold market condition and the potential for price increase (upward movement). Some traders interpret an oversold currency pair as a sign that the downtrend may reverse, meaning it is a buying opportunity.Values above 70 indicate an overbought condition and the potential for price weakness. Some traders interpret an overbought currency pair as a sign that the uptrend may reverse, meaning it is a selling opportunity.
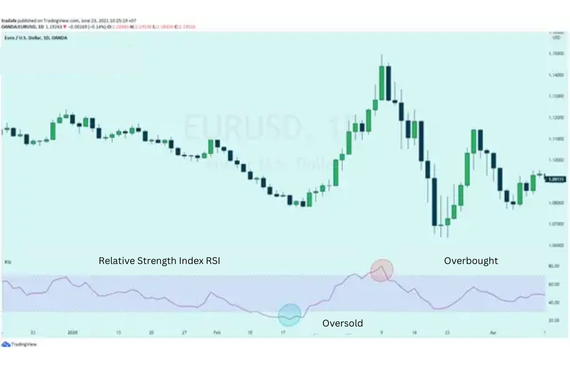
In addition to signaling overbought and oversold conditions mentioned earlier, traders also use the Relative Strength Index (RSI) to look for centerline crossover points.
A movement from below the centerline (50) to above it indicates an uptrend.
A centerline crossover upwards occurs when the RSI value crosses above the 50 line, moving toward the 70 line. This suggests that the market trend is gaining strength and is considered a bullish signal until the RSI approaches the 70 line.
A movement from above the centerline (50) to below it indicates a downtrend.
A centerline crossover downwards occurs when the RSI value crosses below the 50 line, moving toward the 30 line. This indicates that market strength is weakening and is considered a bearish signal until the RSI approaches the 30 line.
1. HOW TO TRADE WITH THE RSI INDICATOR
RSI can be used similarly to the Stochastic indicator.
We can use it to identify potential peaks and troughs depending on whether the market is overbought or oversold.
Below is a 4-hour chart of the EUR/USD currency pair.
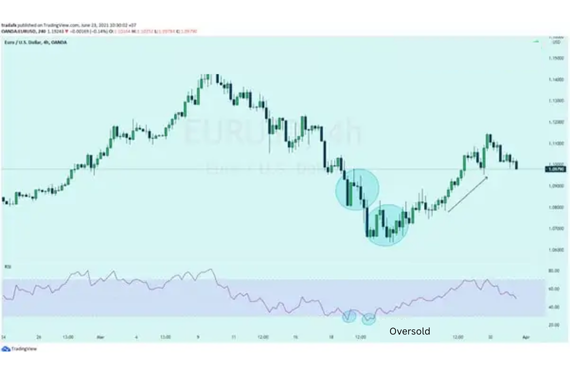
The exchange rate of the EUR/USD pair declined during the week, dropping about 800 pips over the past two weeks.
On March 20, it traded below the 1.0700 level.
However, the RSI dropped below 30, signaling that there might no longer be sellers in the market, and the downward move could be nearing its end.
The price then reversed and began to rise again in the following weeks.
2. IDENTIFYING TRENDS WITH RSI
RSI is a widely used tool in trading knowledge because it can also be used to confirm trend formations.
If you think a trend is forming, check the RSI and observe whether it is above or below 50.
If you think an UPTREND might occur, ensure that the RSI is above 50.
If you think a DOWNTREND might occur, ensure that the RSI is below 50.
At the beginning of the chart above, we can see that a downtrend might be forming.
To avoid a false breakout, we could wait for the RSI to cross below the 50 level to confirm the trend direction.
Indeed, when the RSI crosses below the 50 level, it is a strong confirmation that the downtrend has truly formed.
- t.me/finance_solutes
- Website: https://finance-solutes.com
- Hotline: +1 929 5636 439 ( Hotline )
- 26 Broadway, Suite 934, New York, 10004, US
