
 XM
XM Bybit
Bybit Binance
 Robinhood
 Webull
 IC Markets
 Pepperstone
 OKX
OKX Vantage
 VT Markets
 BingX
BingX Gate.io
 Kucoin
 MEXC
MEXC Exness
 Bitget
The Pin Bar candle is one of the important candlestick patterns in Price Action trading. The psychology behind this pattern lies in the market’s price rejection, which reflects the fierce struggle between buyers and sellers, while also providing a reliable reversal signal. So, what is the Pin Bar pattern? How can this pattern be applied to the Forex market? Let’s explore with TradaFX in today’s article.
1. WHAT IS THE PIN BAR CANDLE PATTERN?
1.1. What is a Pin Bar?
The Pin Bar candle is a Japanese candlestick pattern with a unique shape, characterized by a wick (shadow) that is much longer than its body. The long wick represents the market’s price rejection when one side tries to push the price in its desired direction, only for the opposing side’s pressure to be stronger, causing the price to move in the opposite direction.
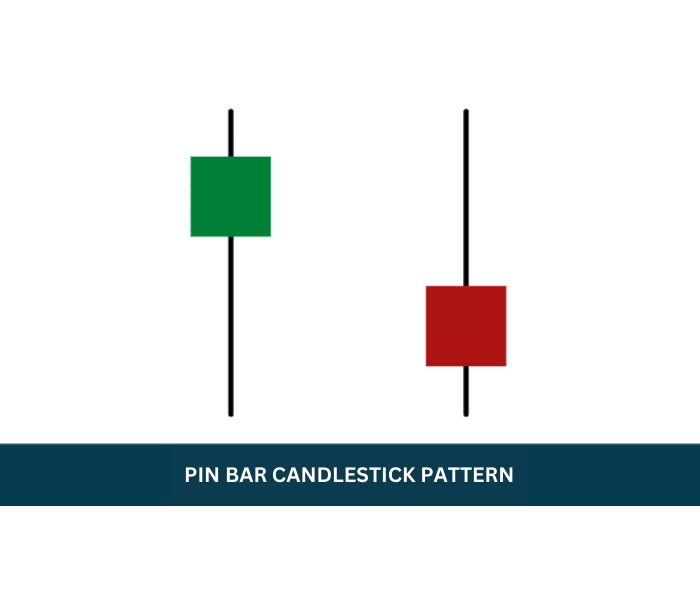
In the Price Action trading method, the Pin Bar candle pattern is used as a powerful reversal pattern. It is almost suitable for all trading instruments across all financial markets, including stocks, Forex, and cryptocurrencies.
1.2. Characteristics of the Pin Bar Candle Pattern.
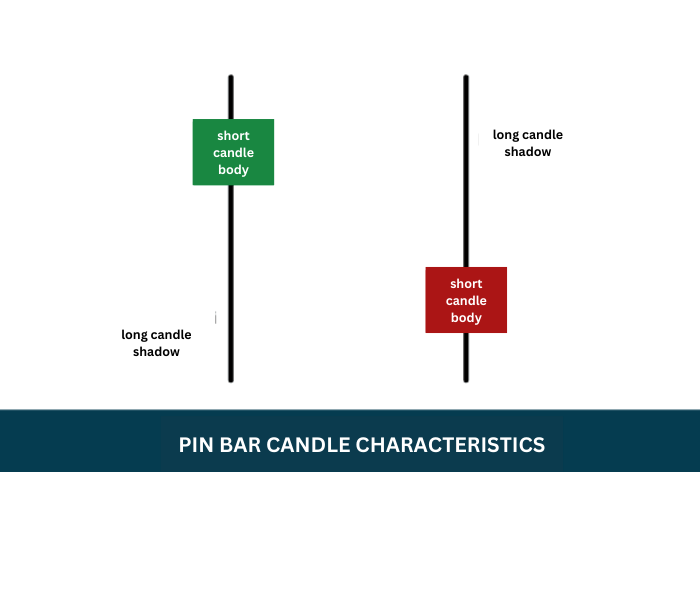
- The body of a Pin Bar candle is relatively short (the shorter, the better); sometimes, you may even see the body appear as a horizontal line. The body is typically positioned on one side (either the top or bottom), resulting in one very long wick and one short wick.
- A Pin Bar can be either a bullish or bearish candle.
- One very long wick must be at least twice the length of the body; the shorter the other wick, the more effective the pattern.
- The longer wick of the Pin Bar must account for at least 2/3 of the total candle length; otherwise, the effectiveness of the candle diminishes significantly.
1.3. The Significance of the Pin Bar Candle Pattern
The market is always a battlefield, and this pattern reflects the intense struggle between buyers and sellers on the price chart. If buyers dominate, the price rises, and the pattern records a green candle body. Conversely, if sellers prevail, the price drops, and the pattern records a red candle body.
This is what many traders seek on the chart, and the Pin Bar represents such a battle.
2. TYPES OF PIN BAR CANDLES
Pin Bars are divided into two types: Bullish Pin Bars and Bearish Pin Bars. Both must meet the characteristics of a Pin Bar as described above by TradaFX.
2.1. Bullish Pin Bar
A Bullish Pin Bar pattern features a very long lower wick and a short or nearly absent upper wick. The color of the candle does not matter; it can be a bullish candle (green) or a bearish candle (red).
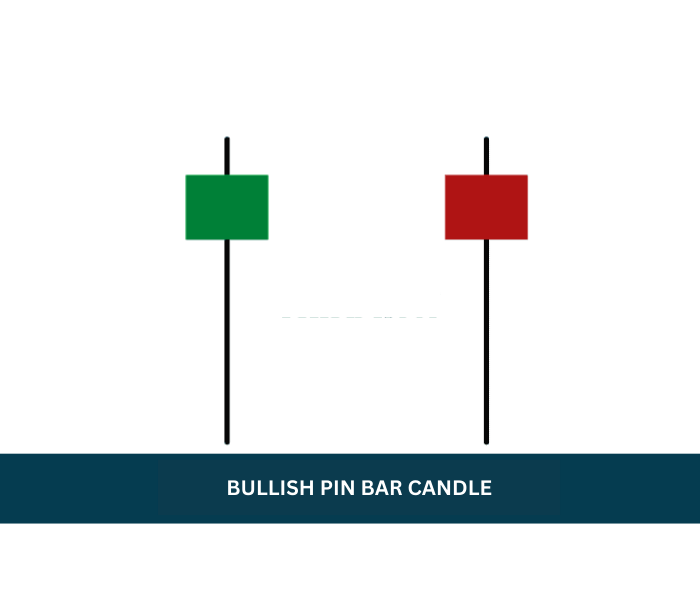
Significance: The long lower wick indicates that sellers made a strong effort to push the price significantly lower, but strong buying pressure brought the price back near the opening level (a rejection of lower prices). Thus, in this market battle, the buyers have gained the upper hand.
Bullish Pin Bars typically appear at the end of a downtrend; you can execute a BUY order when this candle appears to earn a profit.
2.2. Bearish Pin Bar
A Bearish Pin Bar pattern features a very long upper wick and a short or nearly absent lower wick. The color of the candle is not important in this case; it can be a bullish candle (green) or a bearish candle (red).
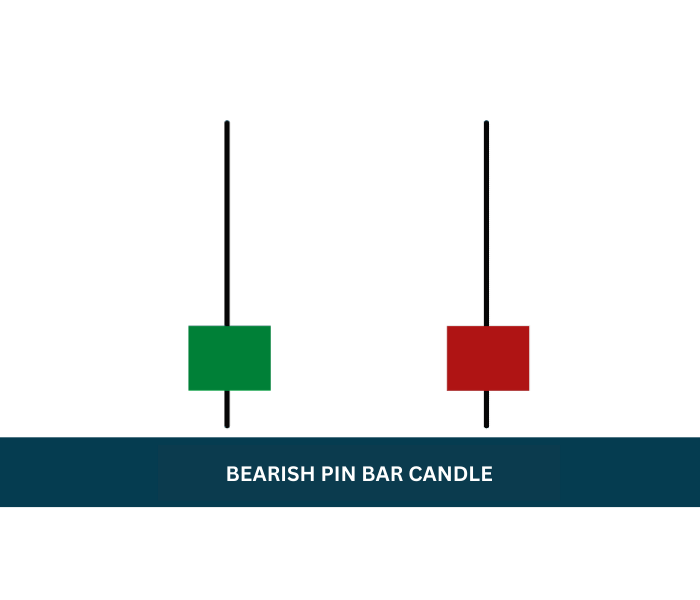
Significance: The long upper wick indicates that buyers made a strong effort to push the price significantly higher, but strong selling pressure brought the price back near the opening level (a rejection of higher prices). Thus, in this battle, while buyers initially seemed to hold the advantage, sellers ultimately prevailed.
Bearish Pin Bars typically appear at the end of an uptrend; you can execute a SELL order when this candle appears.
3. TRADING WITH PIN BARS
Pin Bars are generally more suitable for short-term trading strategies, such as scalping, rather than long-term trading. Typically, there are three ways to enter a trade:
3.1. Entering at Market Price
When the market is in a strong trend, and a Pin Bar appears, the price often moves quickly right after the candle closes. Therefore, traders need to identify the Pin Bar and place an order immediately after it closes.
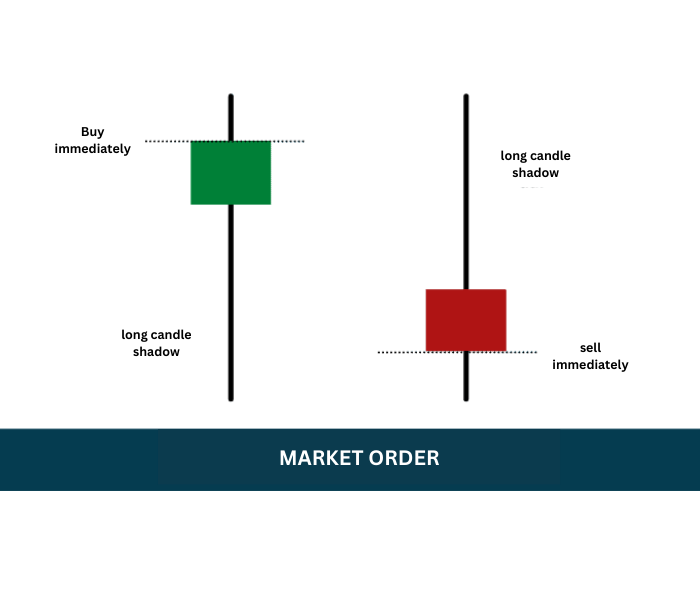
- With Bullish Pin Bar: Place a BUY order when the candle closes
- With Bearish Pin Bar: Place a SELL order when the candle closes
3.2. Entering with Stop Orders
With Stop Orders, you place a Pending Order at a price level higher or lower than the current market price.
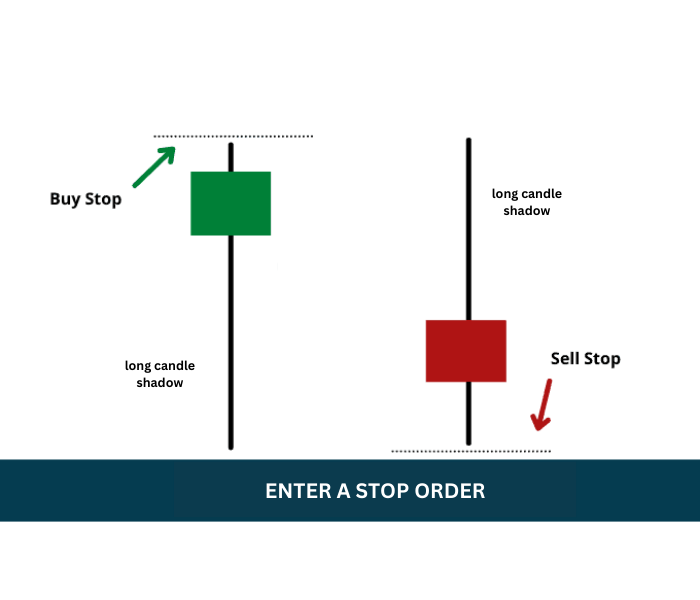
Bullish Pin Bar: Place a Buy Stop order just above the highest point of the Pin Bar candle, around 1 pip.
Bearish Pin Bar: Place a Sell Stop order just below the lowest point of the Pin Bar candle, around 1 pip.
3.3. Entering with Limit Orders
With a Limit Order, you place a pending order at a price higher than the current price to sell, or lower than the current price to buy. Many traders believe that after a Pin Bar candle, the price often retraces to the middle of the candle before continuing in its original direction. Therefore, a Limit Order is placed at the 50% level of the candle.
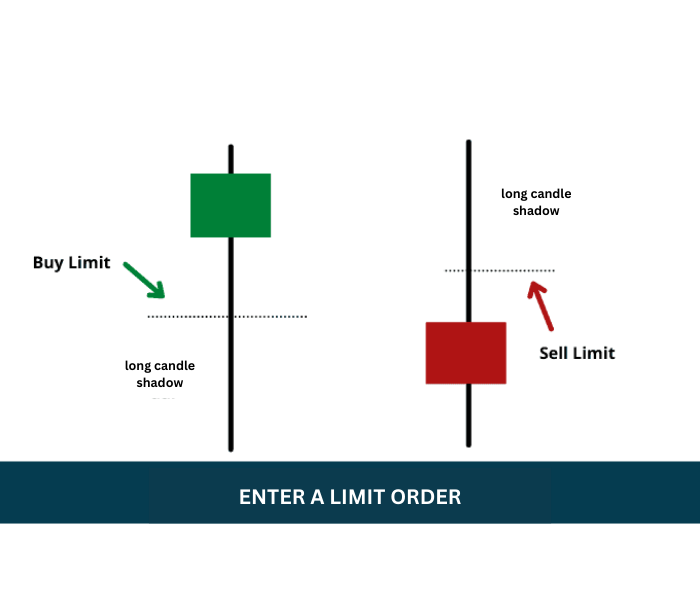
- Bullish Pin Bar: Place a Buy Limit order at 50% of the candle.
- Bearish Pin Bar: Place a Sell Limit order at 50% of the candle.
By using Pending Orders, traders can capitalize on larger profit potential. However, if the price does not move in the desired direction, a stop-loss will be triggered. Therefore, it is essential to always set the Stop Loss just above or below the Pin Bar candle’s high/low to minimize forex risk.
4. PIN BAR STRATEGY FOR PROFITABILITY
The key to becoming a profitable trader is to set odds in your favor. Even the best prediction of the market’s direction only has a 50% chance of being accurate. Ultimately, as a forex trader, you only have two options: buy or sell. So, what happens when we accept these odds and start incorporating other factors that could yield results? Naturally, your success rate begins to increase. We call these the confluence factors that help tip the odds in your favor.
These factors may include trend trading, using price action signals, and always maintaining an appropriate risk-to-reward ratio.
To profit from these confluence factors, you must follow a forex trading plan. This will help you stay accountable for the trades you make, and also prevent you from making impulsive trades.
By using a simple checklist, you can quickly and easily identify the best setups. Let’s consider some key factors that should be included in your checklist.
4.1. Does the Trade Setup Follow the Trend?
By now, Forex is sure you’ve heard the phrase, “The trend is your friend.” While this may be one of the oldest sayings, it is also one of the most accurate.
However, despite its popularity, many still disagree. They argue that trying to catch the current trend is more difficult than predicting the future trend. In my experience, this is far from the truth.
Think of trends as the momentum or current of the market. The strongest trends, which continue for weeks, months, or even years, are often supported by banks and hedge funds. I don’t know about you, but I would rather go with these players than try to fight against them.
Here’s a great example of a strong trend on the XAUUSD Daily chart:
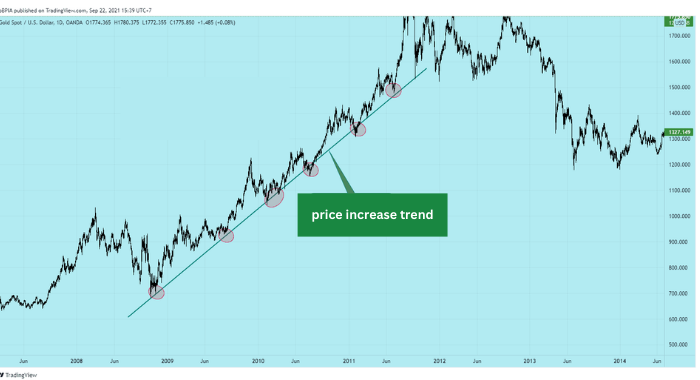
The chart above is an example of a time when you should only look for bullish price action signals. This uptrend is a strong indication that smart money is buying, and you should be doing the same.
Just remember, when in doubt, trade in the direction with the least resistance.
4.2. Is the Trade Setup at a Key Support or Resistance Level?
How can some traders claim that “the trend is not your friend”? Simply put, they don’t know how to identify the key “event zones” in the current trend.
This leads to blindly buying or selling in the respective uptrend or downtrend. This is the quickest way to blow your trading account. A better approach is to use what are known as event zones, to identify potential support or resistance levels in a trending market.
Let’s look at a key event zone in the same XAUUSD uptrend on the Daily chart:
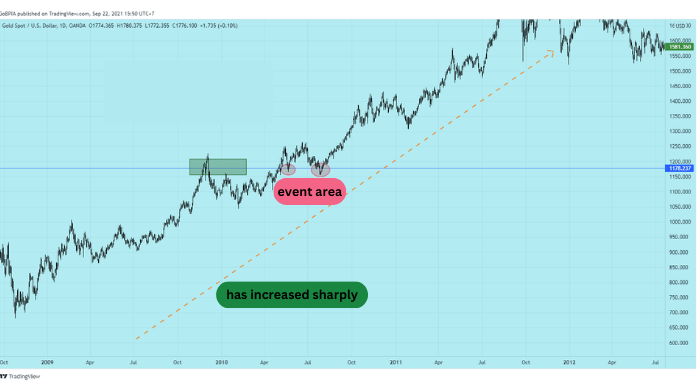
Note that Forex is still using bullish momentum to its advantage. However, instead of blindly targeting a buy position, we are using a key event zone to look for bullish price action. This zone is created by an old resistance area, which becomes a support zone when the market breaks through it.
These event zones can be found in any uptrend or downtrend. They can provide setups that are extremely favorable with low risk for trend-following trades.
4.3. Is there a valid price action signal right now?
This is an important part of the checklist with confluence factors for any price action trader. Using event zones in a strong trend is a great start, but to assess whether a level of resistance is valuable, you need to look for a valid Pin Bar signal.
Why do I say you need a “valid” Pin Bar signal? Because simply seeing a price action signal at a key level is not enough. It must confirm that the level is likely to hold and form in the direction of the prevailing trend.
Here is a great example of using the Pin Bar trading method as a confirmation signal in an uptrend
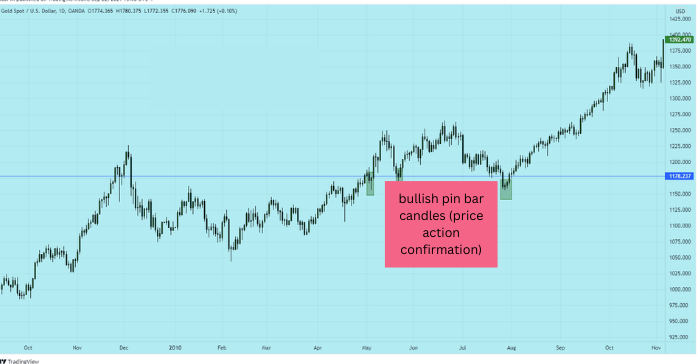
Note how these bullish Pin Bar candles are formed and respect the key support level. The actual trade setup would occur at the first Pin Bar candle, with the second Pin Bar further supporting the idea that the level of resistance may hold.
Additionally, Forex recommends using a distance of about 10 pips between the stop loss and the tail of the Pin Bar.
4.4. Does the trade setup allow for an appropriate risk-to-reward ratio?
Using an appropriate risk-to-reward ratio is an essential component of successful Forex traders. What is an appropriate risk-to-reward ratio? Simply put, an appropriate risk-to-reward ratio means you never risk more than half of your potential profit.
Using the XAUUSD example, we set up the trade with a 60 pip stop loss when entering right after the Pin Bar is formed. Therefore, the profit target needs to be at least 120 pips away from the entry point (60 x 2). As seen in the chart below, the next reasonable resistance area is the most recent high. This gives us a higher risk-to-reward ratio.
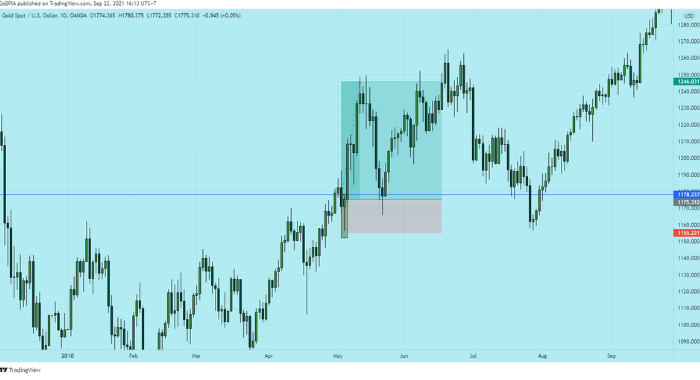
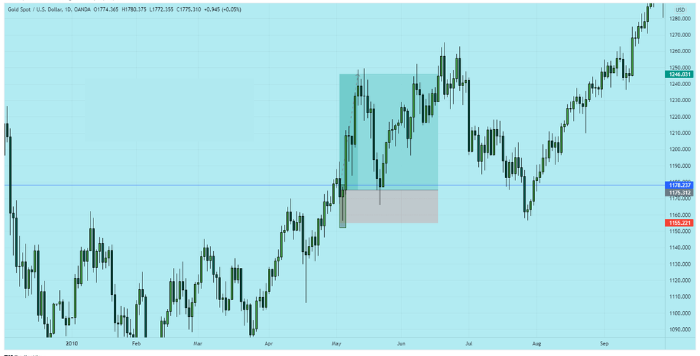
In the setup above, we placed a 60 pip stop loss. If we measure from the entry point to the profit target, we can see the distance is 350 pips. This figure is much higher than the 120 pips required to meet the appropriate risk-to-reward ratio. Therefore, we can accept this in the checklist as it certainly meets the criteria.
In practice, this setup results in a 5.8R trade. This means that if you risked $100, you would earn $580 ($100 x 5.8). That is the power of using an appropriate risk-to-reward ratio.
5. NOTES WHEN TRADING WITH LONG-TAILED PIN BAR PATTERNS
– For new traders, it is recommended to use chart timeframes from H4 to 1 day or higher with Pin bar candles for better accuracy.
– This candle should not be used alone; it should be combined with other technical indicators such as support and resistance levels, RSI, Fibonacci, etc.
– Using Pin Bar candles in conjunction with technical analysis is always a smart strategy to improve trading efficiency and minimize risk.
6. SUMMARY
So, through today’s article, you now know that the Pin bar pattern is a very valuable “weapon” in your trading toolkit. Understanding the psychology behind it will help you visualize situations where this candle pattern appears. We hope the insights we’ve shared will be helpful to you in your Forex trading journey.
Wishing you success in your trading career!!!
- t.me/finance_solutes
- Website: https://finance-solutes.com
- Hotline: +1 929 5636 439 ( Hotline )
- 26 Broadway, Suite 934, New York, 10004, US
