
 XM
XM Bybit
Bybit Binance
 Robinhood
 Webull
 IC Markets
 Pepperstone
 OKX
OKX Vantage
 VT Markets
 BingX
BingX Gate.io
 Kucoin
 MEXC
MEXC Exness
 Bitget
Both the MACD and RSI are well-known, reliable indicators that play a crucial role in technical analysis. Therefore, combining these two powerful indicators—MACD and RSI—creates a high-probability forex trading strategy. To learn more about how to combine them, keep reading today’s article!
1. MACD AND RSI
MACD and RSI are two popular oscillators in the market, highly favored by traders in forex trading. While both provide signals to traders, their mechanisms of action are different.
Both indicators are used to measure momentum in the market, but because they measure different factors, they sometimes provide opposing signals. The MACD measures the relationship between two moving averages, while the RSI measures price changes relative to recent highs and lows.
1.1. MACD Indicator
The MACD consists of the MACD line, the Signal line, and the Histogram. The MACD line is the difference between the 12-period and 26-period Exponential Moving Averages (EMA). The MACD is primarily used to assess the strength of price movements.
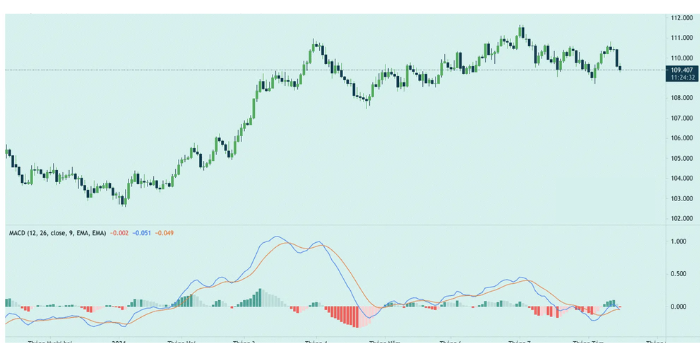
Essentially, a larger gap between the 12-period EMA and the 26-period EMA indicates an increase in market momentum, either upward or downward. This difference is represented through the Histogram, which is the bar chart in the MACD indicator.
When the MACD line crosses above the Signal line, it gives traders buy/sell signals. A crossover from below upwards provides a buy signal, while a crossover from above downwards gives a sell signal.
Additionally, when the MACD line and the price give opposing signals, it is called divergence. When divergence occurs, it signals that the market trend’s momentum is weakening, and the price may be about to reverse.
1.2. RSI Indicator
The RSI (Relative Strength Index) indicates whether the market is overbought or oversold based on recent price levels.
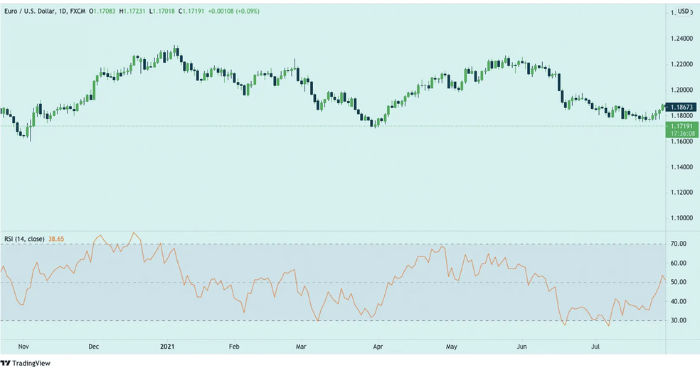
The RSI indicator calculates profit and loss levels over a predefined period. The default period is 14, with values ranging from 0 to 100.
An asset is considered oversold when the RSI is above 70%, and overbought when the RSI is below 30%.
2. COMBINING MACD AND RSI STRATEGY
For forex traders who prefer simple strategies that are not overly complex, the combined MACD and RSI strategy may be the ideal trading approach. By incorporating MACD and RSI into your trading strategy, you can maximize the value of these two indicators while minimizing the risk of false trade signals.
2.1. Confirming Market Momentum
The simplest and most common application of these two indicators is that they can provide clear insights into market momentum. If one indicator signals momentum in a certain direction, check the other indicator to see if it provides a similar signal.
When the two indicators give opposing signals, traders may find it challenging to make decisions. However, when both indicators give the same signal, the signal is more reliable, and traders can feel more confident in executing their trades.
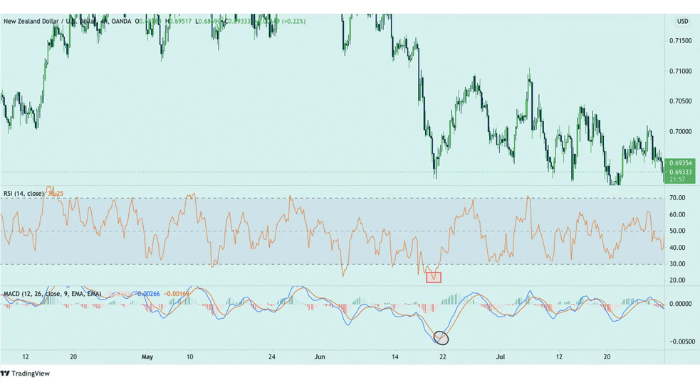
In the NZD/USD chart below, both the RSI and MACD indicators signal a shift in market momentum almost simultaneously. In both cases, it seems that the RSI indicator signals a little earlier than the MACD. Traders who see a signal from the RSI can wait for confirmation from the MACD to ensure it aligns, and then decide whether to open or close a position.
2.2. Identifying Buy/Sell Points
2.2.1. Buy Trade
First, we will use the RSI indicator to monitor when the market is in an oversold condition. This occurs when the RSI crosses above 30%. This signals that a strong reversal in price may be imminent.
To increase the confidence in this signal, wait for the MACD line to cross the Signal line. If the MACD line crosses the Signal line from below, the buy signal is confirmed with greater certainty.
Let’s look at the example below: the price is in a prolonged downtrend, and when the RSI signals oversold conditions, shortly after, the MACD line also crosses above the Signal line. Both indicators signal that a strong price reversal is likely. At this point, we can enter a buy trade. The stop loss would be placed just below the nearest low, and the take-profit point would depend on the trader’s expectations.
2.2.2. Sell Trade
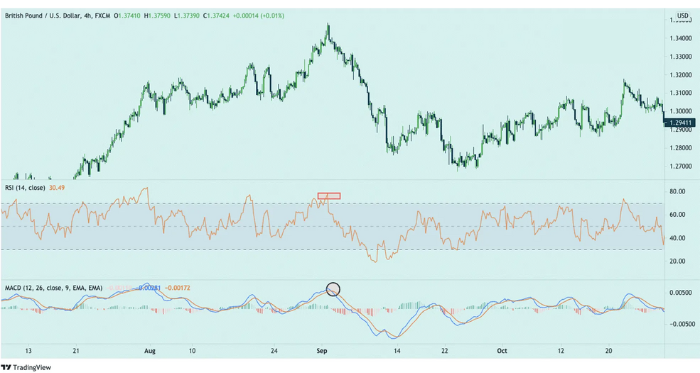
In contrast to the buy trade scenario above, we first use the RSI to monitor when the market is in an overbought condition. The market is considered overbought when the RSI is above 70%. Afterward, wait to see if the MACD line crosses below the Signal line. If it does, this confirms the sell signal.
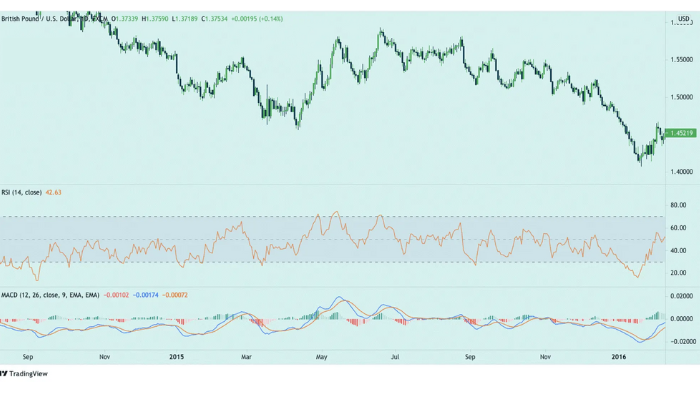
Let’s look at the example below with GBP/USD: the price is in a strong uptrend, and there are multiple overbought signals from the RSI, but the MACD line does not cross below the Signal line. To be more certain, enter the sell trade when the MACD line crosses below the Signal line from above.
Although combining MACD and RSI is quite popular due to their proven effectiveness over time, it does not mean they never provide false signals, even when used together. Therefore, never become complacent; always apply risk management strategies to protect yourself from losses caused by false signals.
When both indicators provide the same signal, it is often more reliable and can give traders greater confidence. This strategy can yield higher profits with a tighter stop loss.
3. CONCLUSION
Like other indicators, both MACD and RSI are not perfect, and they can provide false signals. Therefore, you can only experience this for yourself and draw your own conclusions.
I hope this article helps you add another effective forex trading strategy to your trading system. Wishing you success!
- t.me/finance_solutes
- Website: https://finance-solutes.com
- Hotline: +1 929 5636 439 ( Hotline )
- 26 Broadway, Suite 934, New York, 10004, US
