
 XM
XM Bybit
Bybit Binance
 Robinhood
 Webull
 IC Markets
 Pepperstone
 OKX
OKX Vantage
 VT Markets
 BingX
BingX Gate.io
 Kucoin
 MEXC
MEXC Exness
 Bitget
The Harami candlestick pattern is commonly used in forex trading knowledge to identify potential reversals or continuations of trends. Traders take advantage of the signals created by the Harami candlestick, which makes the pattern highly useful.
1. WHAT IS A HARAMI CANDLESTICK? HOW TO IDENTIFY THE HARAMI CANDLESTICK PATTERN
The Harami candlestick pattern consists of two candles that indicate a potential reversal or continuation of the market trend.
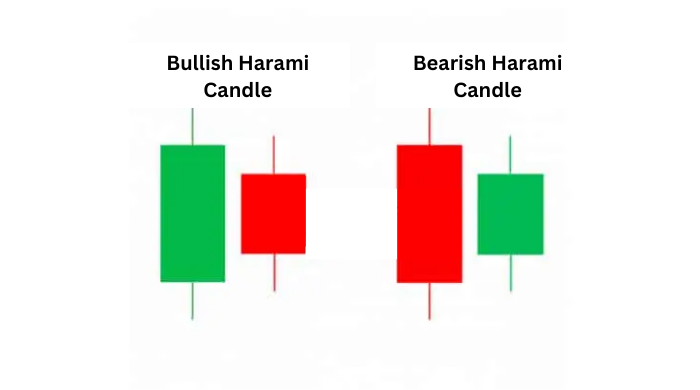
The word “Harami” comes from Japanese, meaning “pregnant,” representing the Harami candlestick pattern. The Harami candlestick pattern is divided into two types: the Bullish Harami and the Bearish Harami, as seen below:
2. BULLISH HARAMI CANDLESTICK PATTERN
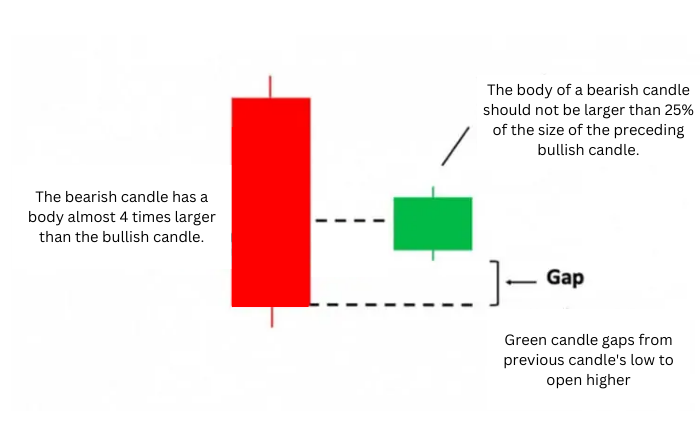
The Bullish Harami candlestick pattern is a reversal pattern that appears at the bottom of a downtrend. It consists of a large bearish candle followed by a smaller bullish candle that is completely contained within the body of the previous bearish candle. This indicates a shift in momentum; the small bullish candle “creates a gap” by opening near the middle range of the previous candle.
2.1. Bullish Harami Cross Candlestick Pattern
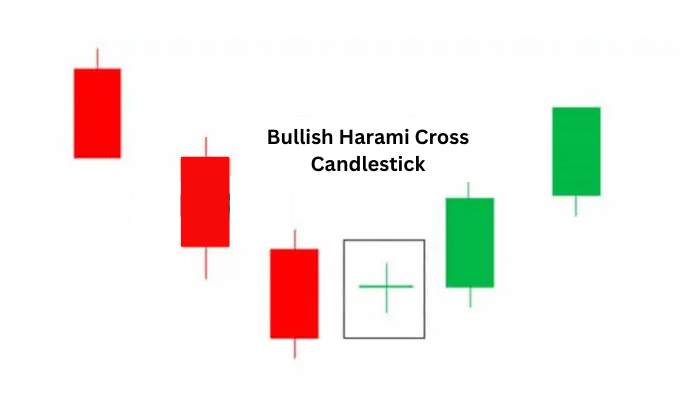
Traders often look for the second candlestick in the pattern to be a Doji. The reason for this is that a Doji represents indecision in the market. The color of the Doji (black, green, red) is not particularly important because the Doji itself, when appearing near the bottom of a downtrend, will provide a bullish signal. The Bullish Harami Cross pattern also offers an attractive risk-to-reward ratio because the bullish movement (once confirmed) is just beginning.
2.2. How to Identify the Bullish Harami Pattern
– Identify an existing downtrend.
– Look for signals that indicate momentum is slowing down or reversing (using oscillators like Stochastic, crossover of moving averages, or the formation of the next bullish candlestick).
– Ensure that the body of the green candlestick (the small candle) does not exceed 25% of the body of the previous bearish candlestick. The stock price will create an upward “gap,” represented as a green candlestick positioned within the previous candlestick. Forex charts will typically show two candles side by side.
– Observe that the entire bullish candlestick is contained within the length of the previous bearish candlestick’s body.
– It is recommended to combine with supporting indicators or significant support levels.
2.3. Formation of the Harami Candlestick Pattern in the Market
2.3.1. Formation on Forex Charts
The forex market operates on a 24/5 basis, meaning that when one candlestick closes, another one opens at a price close to the previous candlestick’s closing price. This is usually observed in normal market conditions, but it may change during periods of high volatility. The Bullish Harami pattern in Forex typically looks like the image below:
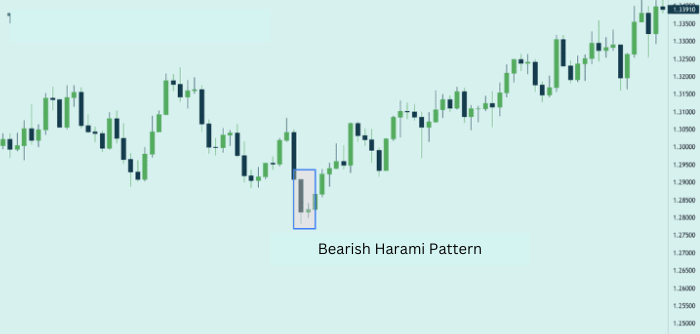
The small green candlestick opens at the same level where the previous bearish candlestick closed. This is commonly observed in the forex market.
2.3.2. Formation on Stock Charts
Unlike forex, stocks have specific trading hours during the day, and there are several factors that can create a “gap” when the bullish candlestick opens. Some of these factors include:
- Important news released after the trading session ends
- National/regional economic data
- Bid prices or company mergers
- General market sentiment
As a result, the traditional Harami pattern forms, as shown below:

Note that there are many places on the chart where the market has created a “gap” – showing wide spaces between candlesticks. This is commonly observed in the stock market.
3. BEARISH HARAMI CANDLESTICK PATTERN
The Bearish Harami candlestick pattern is a reversal pattern that appears at the top of an uptrend. It consists of a large bullish candlestick followed by a smaller bearish candlestick that is completely contained within the body of the previous bullish candlestick. This indicates a shift in momentum, with the small bearish candlestick “creating a gap” by opening near the middle range of the previous candlestick.
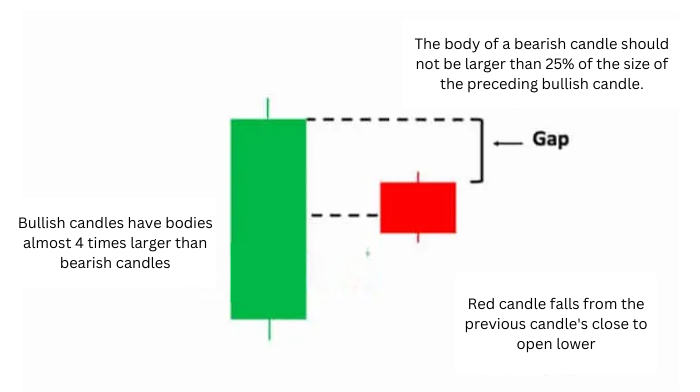
3.1. How to Identify the Bearish Harami Pattern
– Identify the existing uptrend.
– Look for signals indicating that momentum is slowing down or reversing (by using oscillators like Stochastic, moving average crossovers, or the formation of the next bearish candlestick).
– Ensure that the body of the small red candlestick does not exceed 25% of the body of the previous bullish candlestick. The stock creates a downward “gap,” indicating that the red candlestick is within the range of the previous bullish candlestick. The gap may not be found in candlestick patterns in forex trading because they will almost always open at the same level as the previous candlestick’s close or very close to it.
– The body of the bearish candlestick is fully contained within the length of the previous bullish candlestick’s body.
– Combine this pattern with supporting indicators, important resistance levels, or other confirmations to aid your trade.
3.2. Formation of the Harami Candlestick Pattern in the Market
The Bearish Harami pattern in Forex typically looks like the image below:
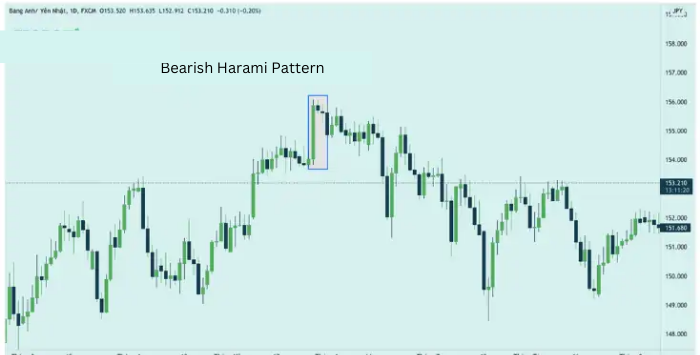
The small red candlestick opens near or at the same level where the previous bullish candlestick closed.
Below is an example of a stock chart for FTSE 100, Lloyds Banking Group PLC, where the Bearish Harami candlestick pattern appears:
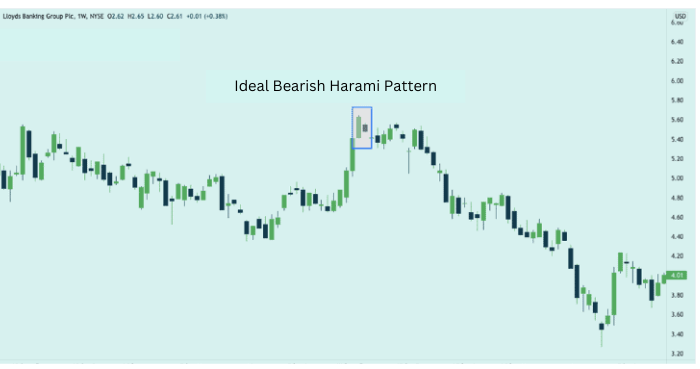
Note that there are many points on the chart where the market has created a “gap.” This is reflected by wide spaces between the candlesticks.
4. TRADING THE HARAMI CANDLESTICK PATTERN
The Harami candlestick pattern is popular because it allows traders to capture trend reversals at the best possible moments with low risk. This can lead to a very favorable risk:reward ratio. Traders must understand the origin of this candlestick pattern, as it is crucial for trading trend reversals with the Harami pattern. Additionally, you should be mindful of how it is used with other technical tools.
4.1. Trading Trend Reversals with the Harami Candlestick
Let’s take a look at the EUR/CAD chart example below:
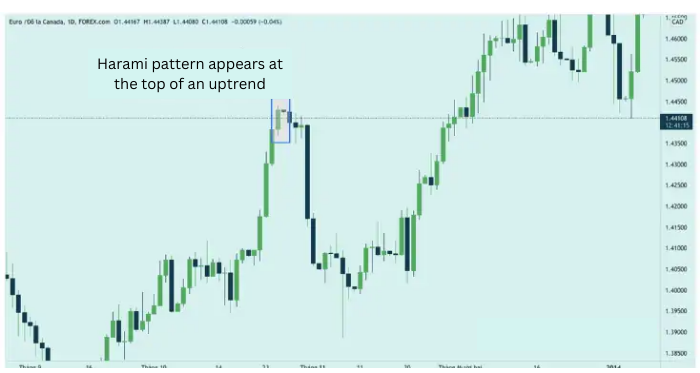
The chart above shows a Bearish Harami candlestick pattern in play on the EUR/CAD currency pair. The daily chart was previously in an established uptrend.
However, the price tends to pull back along the way. This latest pullback begins with the formation of a Harami candlestick pattern. With its appearance, the market is set at the current high. The market then quickly drops sharply.
Traders are looking to capitalize on the Bearish Harami pattern to add it to any existing trend-following trading plan. Traders may seek to close any existing buy positions and even consider a trend reversal trade when this candlestick pattern appears.
4.2. How to Trade with the Bullish Harami Candlestick Pattern
Traders can apply the Bullish Harami candlestick pattern using the 5-step list mentioned earlier in the article. Looking at the chart below for the GBP/USD pair, we can observe the following:
- There is a clear downtrend.
- A Bullish Hammer candlestick pattern appears before the Bullish Harami pattern, providing the first clue that the market may be about to reverse.
- The green candlestick does not exceed 25% of the length of the previous candlestick.
- The body of the green candlestick is entirely within the length of the previous candlestick.
- The RSI indicators provide a signal that the market is oversold. This means the downward momentum is reaching a bottom, but traders should wait for the RSI to cross above the 30 level to confirm accurately.

Stop-loss points can be placed below the lowest point, and traders can enter the market at the opening of the next candlestick, completing the Bullish Harami pattern. Since the Bullish Harami candlestick pattern appears at the start of a potential uptrend, traders may have several take-profit levels to create a new, extended uptrend. These take-profit levels can be set at nearby support and resistance levels.
4.3. Trading Guide with the Bearish Harami Candlestick Pattern
Looking at the example chart earlier, we can recognize the following when looking to trade the Bearish Harami pattern:
- There is a clear uptrend.
- RSI indicators provide a signal that the market is overbought. This means the upward momentum is weakening. However, traders should wait for the RSI to cross above the 70 level to confirm a more accurate signal.
- The red candlestick does not exceed 25% of the length of the previous green candlestick.
- The body of the red candlestick is entirely within the length of the previous green candlestick.
- This pattern appears at the top of an uptrend, so traders should be aware that the market has already started to decline from a previous high, suggesting the possibility of the market continuously creating lower lows. Typically, the subsequent price action will also support the bearish momentum of the Harami candlestick pattern.

Stop-loss points can be placed at the new peak. Traders can enter a trade when the next candlestick opens – when the Bearish Harami pattern has just completed. Since this pattern appears at the beginning of a potential downtrend, traders may have multiple take-profit levels to create a new, extended downtrend.
5. CHARACTERISTICS OF A RELIABLE HARAMI PATTERN
Like all other candlestick patterns, the validity of the Harami pattern depends on price action around it, indicators, where it appears in the trend, and important resistance levels. Here are some advantages and disadvantages of this candlestick pattern:
Advantages:
- Entry points are reliable when this pattern appears at the start of a potential trend.
- It can provide a more attractive risk:reward ratio compared to the Bearish Engulfing candlestick pattern.
- Easy to identify for new traders.
Disadvantages:
- One should not trade based solely on the appearance of the Harami pattern, whether it is a Bullish or Bearish Harami.
- The location of the pattern in the trend is very important. For example, the Bearish Harami pattern must appear at the peak of an uptrend.
- Requires knowledge of technical analysis or popular supporting indicators such as RSI, Stochastic, etc.
- t.me/finance_solutes
- Website: https://finance-solutes.com
- Hotline: +1 929 5636 439 ( Hotline )
- 26 Broadway, Suite 934, New York, 10004, US
