
 XM
XM Bybit
Bybit Binance
 Robinhood
 Webull
 IC Markets
 Pepperstone
 OKX
OKX Vantage
 VT Markets
 BingX
BingX Gate.io
 Kucoin
 MEXC
MEXC Exness
 Bitget
Traders in the Forex market are surely familiar with the term “confluence,” which is a technique using advanced Ichimoku Cloud. This term refers to the use of one tool combined with another to create a more powerful trading method. And Ichimoku is no exception. Today’s article from Forex will delve into the details of how to combine the Ichimoku indicator with other technical indicators.
1. ICHIMOKU AND RSI COMBINATION STRATEGY
The Ichimoku Cloud is well-known as an independent indicator that can indicate the direction of trends, market momentum, as well as determine support and resistance levels. However, to get more reliable confirmation, traders should combine Ichimoku with other indicators. One of the most common indicators to combine with Ichimoku is the RSI.
1.1. RSI Indicator
RSI stands for Relative Strength Index, a momentum oscillator used in technical analysis to help traders evaluate the strength of the current market. It is represented as a line chart that moves between two extreme points and can read values from 0 to 100.
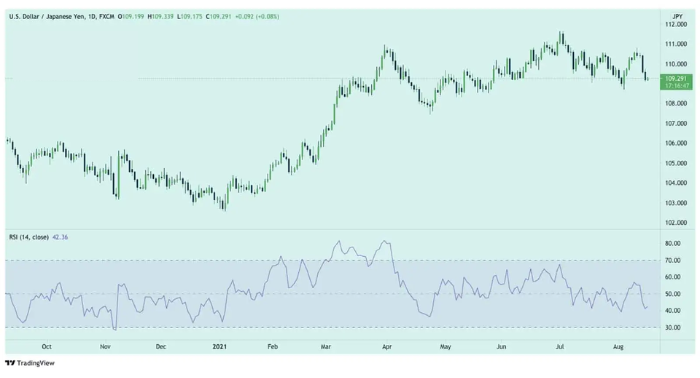
RSI was developed by J. Welles Wilder Jr. and introduced in his 1978 book, New Concepts in Technical Trading Systems.
An asset is considered overbought when the RSI is above 70% and oversold when it is below 30%.
1.2. Searching for RSI Divergence Signals
The first step when implementing the Ichimoku strategy combined with RSI is to identify divergence signals using the RSI. Divergence is simply when the price moves in the opposite direction of a technical indicator. A divergence signal warns that the current price trend may be weakening and, in some cases, could lead to a reversal of the price.
There are two types of divergence: bullish divergence and bearish divergence. Bullish divergence indicates the price could rise further, while bearish divergence signals the price may drop.
Returning to identifying divergence signals with RSI, let’s look at an example using the AUD/USD pair with a divergence signal:
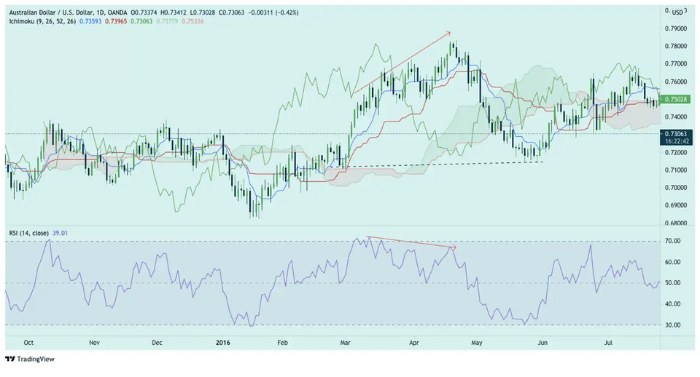
Looking at the chart, we can see that the price is continuously creating higher peaks, while the RSI is creating lower peaks consecutively. Therefore, we can identify this as a bearish divergence signal.
1.3. Entry Points, Take-Profit, and Stop-Loss
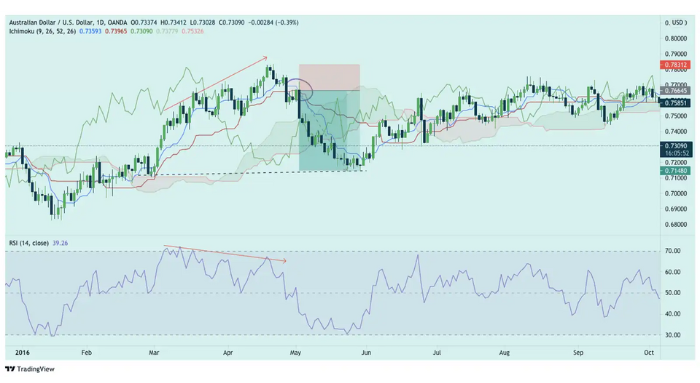
Once we have identified a bearish divergence signal while the market is in an uptrend, it indicates that the upward momentum may be weakening and the price could soon reverse to the downside. Therefore, we will look for a selling signal here.
As introduced in the Ichimoku Cloud trading system, when the Tenkan-sen line crosses below the Kijun-sen line, we enter a sell position. The crossover point between the two lines will be our entry point. Since divergence signals are often highly accurate and reliable, we will place the take-profit level at a support level and set the stop-loss just above the entry point. See the illustration below:
2. ICHIMOKU AND MOVING AVERAGE COMBINATION STRATEGY
The Ichimoku Cloud is a complex indicator made up of five lines. Four of these five lines in the Ichimoku Kinko Hyo indicator are moving averages. Therefore, traders can combine the advanced Ichimoku Cloud with moving averages to create a much simpler trading strategy.
Since both are trend indicators, their functions are almost identical. However, the key difference between these two indicators lies in their ability to identify future support and resistance levels and determine market trends from short to long-term.
2.1. Overview of Moving Averages
A moving average (MA) is a trend indicator and a simple technical analysis tool. The two most commonly used moving averages are the Simple Moving Average (SMA) and the Exponential Moving Average (EMA).
In this strategy, we will use the EMA 20 and EMA 50 combined with the Kumo Cloud, which is a component of the Ichimoku Kinko Hyo. This trading strategy is best applied on higher timeframes such as the daily chart (D1).
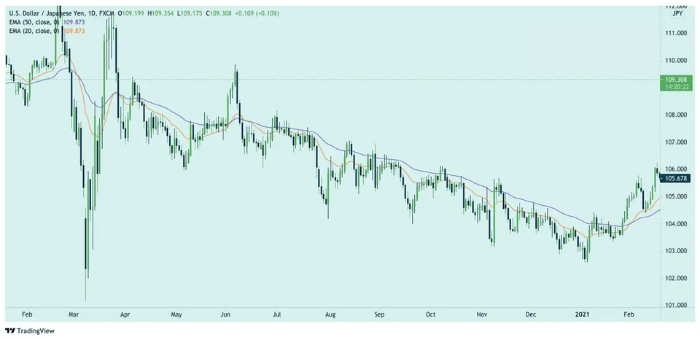
However, it’s important to note that adding two moving averages to the chart to combine with the advanced Ichimoku Cloud can make your chart look quite cluttered. An alternative approach is to use the Ichimoku Cloud combined with candlestick patterns, which is commonly used if you’re a beginner trader. Forex encourages you to apply this trading method, but don’t forget to take the time to fully understand the Ichimoku Kinko Hyo first!
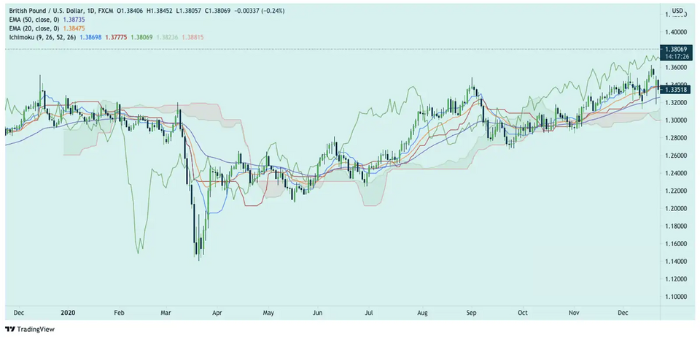
2.2. Entry, Stop-Loss, and Take-Profit
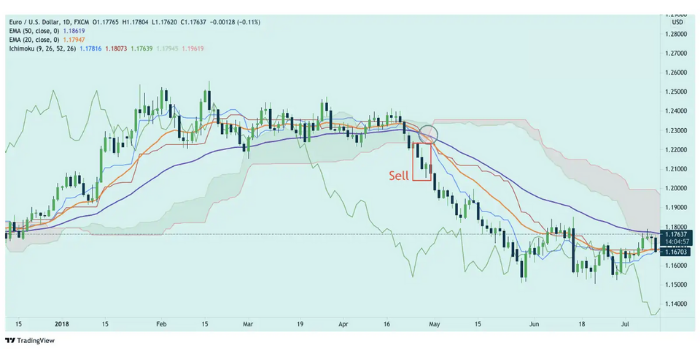
When the two EMA lines cross, and the price cuts through the Kumo Cloud, there are two possible trading ideas:
– If the two EMA lines cross each other, and the price breaks below the Kumo Cloud (meaning the price is entirely below the cloud), this will give a sell signal.
– On the other hand, when the two EMA lines cross each other, and the price breaks above the Kumo Cloud (meaning the price is entirely above the cloud), this will give a buy signal.
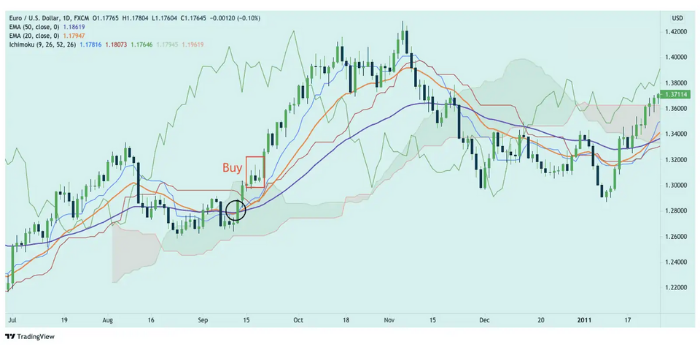
If the price is within the Kumo Cloud and the crossover signal is unclear, you should wait for additional confirmation signals instead of rushing into a trade.
For the stop-loss position, we will use the nearest support/resistance level depending on whether it’s a buy or sell position. As for the take-profit level, it depends on the trader’s expectations, but the minimum risk-to-reward ratio should be 1:1.
3. ICHIMOKU AND MACD COMBINATION STRATEGY
This strategy combines two well-known and highly effective indicators: MACD and the advanced Ichimoku Cloud. Adding MACD to the trading system helps assess momentum and trend strength, making it a great complement to the Ichimoku Cloud for stronger confirmation of the current trend.
3.1. Overview of the MACD Indicator
MACD (Moving Average Convergence Divergence) is a trend-following momentum indicator developed in the late 1970s. It shows the relationship between two moving averages of the price. MACD gives a buy signal when it crosses above the Signal Line and a sell signal when it crosses below the Signal Line.
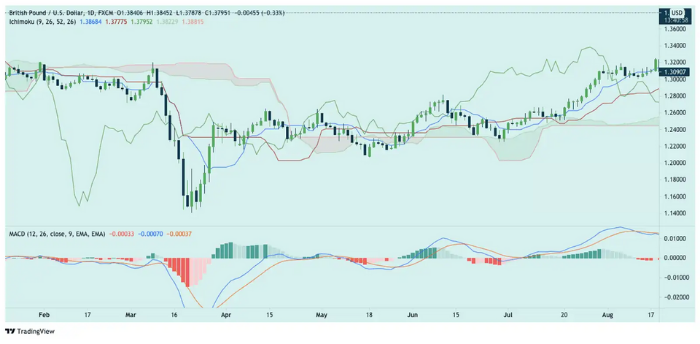
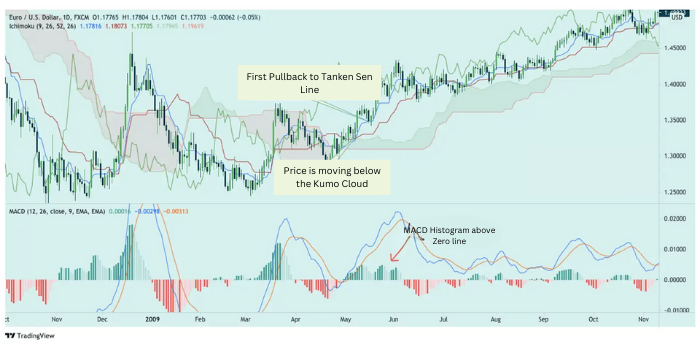
Below is a chart interface showing the combination of Ichimoku and MACD:
3.2. Trading Principles with Buy Signal
- The price of the currency pair must be above the Ichimoku Cloud.
- The MACD Histogram must be above the Zero Line.
- Enter a buy position when the price pulls back to the Tenkan-Sen or Kijun Sen for the first time.
- Set the stop-loss below the Kijun Sen line.
- The take-profit point depends on each trader’s expectations.
3.3. Trading Principles with Sell Signal
- The price of the currency pair must be below the Ichimoku Cloud.
- The MACD Histogram must be below the Zero Line.
- Enter a sell position when the price pulls back to the Tenkan-Sen or Kijun Sen for the first time.
- Set the stop-loss above the Kijun Sen line.
- The take-profit point depends on each trader’s expectations.
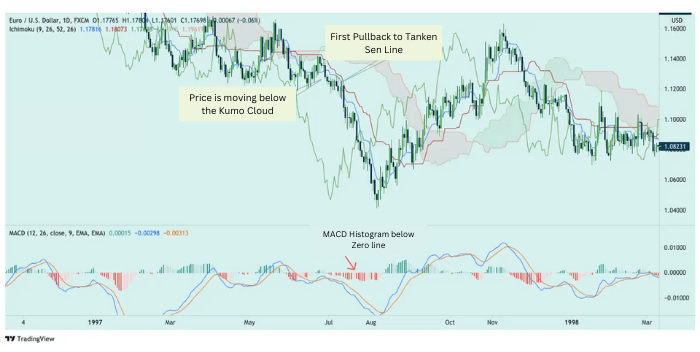
The trading strategy with the advanced Ichimoku Cloud and the MACD indicator is profitable. This method uses the MACD to enhance the success rate, especially in trending markets. However, in ranging markets, it often provides false signals. Therefore, we will only apply this strategy when there is a clear trend.
While the Ichimoku Kinko Hyo is known as an all-in-one indicator, traders can certainly use it alone for trading. However, combining this indicator with others to forecast the market can provide stronger entry signals and lead to better profits for traders. We hope that through this article on combining Ichimoku with other indicators, you can gain new knowledge and consider applying one of these strategies.
Wishing you success!
- t.me/finance_solutes
- Website: https://finance-solutes.com
- Hotline: +1 929 5636 439 ( Hotline )
- 26 Broadway, Suite 934, New York, 10004, US
