
 XM
XM Bybit
Bybit Binance
 Robinhood
 Webull
 IC Markets
 Pepperstone
 OKX
OKX Vantage
 VT Markets
 BingX
BingX Gate.io
 Kucoin
 MEXC
MEXC Exness
 Bitget
In the high-stakes world of financial trading, uncertainty is the only constant. Whether you are navigating the volatile crypto markets or the established corridors of the NYSE, understanding price movement intensity is critical for survival. Many traders mistakenly focus solely on direction, ignoring the underlying “noise” or volatility that can prematurely trigger stop-losses. This is where the Average True Range (ATR) becomes an indispensable tool in your technical analysis arsenal. Developed by J. Welles Wilder Jr., this indicator does not predict trend direction but provides a definitive measurement of market interest and price fluctuation. In this expert guide by Finance Solute, we will dissect the mechanics of ATR, explore its multifaceted applications in risk management, and demonstrate how you can leverage volatility to enhance your trading precision and capital preservation strategies.
Understanding the Fundamentals of Average True Range
The Average True Range (ATR) is a technical analysis indicator that measures market volatility by decomposing the entire range of an asset price for a specific period. Originally designed for the commodities market, which often experiences price gaps, the ATR has since become a staple for traders across all asset classes. Unlike many momentum oscillators, the ATR is non-directional, meaning it rises when volatility increases, regardless of whether the price is moving up or down.
At its core, the ATR represents the moving average of “True Range” values over a set period, typically 14 days. By calculating the distance between highs and lows while accounting for gaps from previous closing prices, it offers a more holistic view of price action than a simple high-minus-low calculation. Finance Solute experts emphasize that understanding ATR is the first step toward professional-grade position sizing and risk control.
The Mathematical Logic Behind True Range
To understand the “Average” part of the indicator, one must first grasp the “True Range” (TR). The TR is defined as the greatest of the following three values:
- The current high minus the current low.
- The absolute value of the current high minus the previous close.
- The absolute value of the current low minus the previous close.
This methodology ensures that price “gaps” occurring between trading sessions are captured. If a stock closes at $100 and opens the next day at $105, a standard range calculation would ignore that $5 jump. The TR captures this “hidden” volatility, providing a more accurate reflection of the asset’s true movement potential.
Calculating the Average True Range
To calculate the Average True Range (ATR), you must first understand that it is a derivative of the True Range (TR). Developed by J. Welles Wilder Jr., the calculation is designed to account for price “gaps” that occur between trading sessions, which standard range calculations (High minus Low) often miss.
Calculating the ATR is a two-step process: first, determining the True Range for each period, and then smoothing those values into a moving average.
Step 1: Determine the True Range (TR)
The True Range is the greatest “distance” covered by the price in a given period. To find it, you must compare three specific price relationships and select the highest value among them:
- Current High minus Current Low: The standard daily range.
- Current High minus Previous Close (Absolute Value): Measures the distance if the market gapped up.
- Current Low minus Previous Close (Absolute Value): Measures the distance if the market gapped down.
The formula is expressed as:

Step 2: Calculate the Average (ATR)
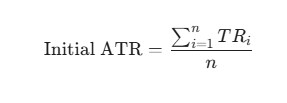
Once you have the True Range for each day, you need to average them over a specific window of time (the “n” period). Wilder originally used a 14-period setting.
The Initial ATR
The very first ATR in a data series is simply the Arithmetic Mean of the first $n$ True Range values:
The Moving ATR (Smoothing)
After the initial calculation, subsequent ATR values are calculated using a smoothing formula similar to an Exponential Moving Average (EMA). This ensures that recent price action has a higher impact while still maintaining historical context:

Practical Example
Assume we are using a 14-day ATR and we have the following data for a single day:
- Current High: $155
- Current Low: $150
- Previous Close: $148
- Previous ATR: $4.50
1. Find the TR:
- High – Low = $155 – 150 = $5
- |High – Prev Close| = |155 – 148| = $7
- |Low – Prev Close| = |150 – 148| = $2
- True Range (TR) = $7 (the largest of the three).
2. Find the New ATR:

Key Considerations for Calculation
- Timeframes: While 14 is the standard, short-term traders often use a 7-period ATR for more sensitivity, while long-term investors may use a 20 or 50-period ATR to gauge structural market shifts.
- Asset Class: For highly volatile assets like Cryptocurrencies, the TR will often be dominated by the gap calculations (|High – Prev Close|) due to 24/7 trading and high slippage.
- Indicator Lag: Because it is an average of past data, the ATR will always “lag” behind a sudden market crash or spike by a few periods.
Why Volatility Analysis Matters in Modern Trading
In modern markets, volatility is often synonymous with risk. However, for a prepared trader, volatility is also synonymous with opportunity. Without movement, there is no profit potential. The challenge lies in distinguishing between “normal” market breathing and an actual change in market regime. ATR helps quantify this “breathing room,” allowing traders to set parameters that are mathematically aligned with the asset’s behavior.
Finance Solute advises that ignoring ATR often leads to “stop-out hunting,” where a trader’s stop-loss is hit by a temporary price spike before the market continues in the predicted direction. By quantifying volatility, you can place your exits outside the range of statistical noise, significantly increasing your “win” rate by staying in trades longer during valid trends.
Distinguishing Volatility from Momentum
A common pitfall for novice traders is confusing high ATR with a strong trend. It is vital to remember that ATR measures the *magnitude* of movement, not the *direction*. A crashing market and a surging market can both exhibit high ATR values. Conversely, a steady, grinding bull market might show a very low and stable ATR.
- High ATR: Indicates large price swings, panic, or intense speculation. This requires wider stop-losses and smaller position sizes.
- Low ATR: Indicates consolidation or a quiet, steady trend. This may allow for tighter stops but carries the risk of a sudden “volatility breakout.”
- ATR Trend: A rising ATR suggests increasing interest and participation, whereas a falling ATR suggests the market is losing steam or entering a period of indecision.
Market Regimes and ATR Behavior
Markets generally cycle between two states: expansion and contraction. During contraction (low ATR), energy builds up. During expansion (high ATR), that energy is released. Strategic traders use ATR to identify these cycles. For instance, an unusually low ATR reading often precedes a massive breakout, serving as a “calm before the storm” warning for observant practitioners.
Strategic Applications of ATR in Risk Management
The most powerful application of the Average True Range is not in entering trades, but in managing them. Risk management is the pillar upon which long-term trading success is built. Finance Solute suggests that incorporating ATR into your risk parameters removes the emotional guesswork and replaces it with data-driven decision-making.
By using ATR-based stops and position sizing, you ensure that your risk is consistent across different assets. A $1 movement in a $10 stock is much more significant than a $1 movement in a $500 stock. ATR normalizes these differences, allowing for a standardized approach to risk across a diversified portfolio.
Calculating ATR-Based Stop Losses
The “ATR Multiple” stop-loss is perhaps the most widely used professional technique. Instead of setting a stop at a random percentage (like 2%) or a fixed dollar amount, you set it at a multiple of the current ATR. Common multiples include 1.5x, 2x, or 3x ATR.
If the ATR of a stock is $2.00, a 2x ATR stop would be placed $4.00 away from the entry price. This ensures that the stop is far enough away to survive normal daily fluctuations but close enough to protect capital if the market structure truly breaks. This method adapts dynamically: when volatility increases, your stops widen automatically; when the market settles, your stops tighten.
Position Sizing Based on Volatility
Standardized position sizing involves risking a fixed percentage of your account (e.g., 1%) on every trade. To calculate the number of shares or contracts to buy using ATR, you can follow this logic:
- Determine your dollar risk (Account Balance x Risk %).
- Determine your stop distance using ATR (e.g., 2 x ATR).
- Divide the dollar risk by the stop distance to get your position size.
This approach means that in highly volatile markets (high ATR), you will trade fewer shares, and in quiet markets (low ATR), you will trade more. This balances your total portfolio risk, ensuring that a single volatile asset doesn’t disproportionately impact your account balance.
ATR Comparison Across Different Asset Classes
| Asset Class | Typical ATR Characteristics | Recommended ATR Multiple | Strategic Implication |
|---|---|---|---|
| Blue-Chip Stocks | Low to Moderate | 1.5x – 2x | Focus on steady trends; use ATR to avoid “noise” stops. |
| Forex (Major Pairs) | Moderate / Consistent | 2x | High liquidity allows for precise ATR-based exits. |
| Cryptocurrencies | Very High / Erratic | 3x – 5x | Extreme volatility requires very wide stops and small positions. |
| Commodities (Oil/Gold) | High / Seasonal | 2.5x | Geopolitical events cause sharp ATR spikes; monitor closely. |
Using ATR for Profit Targets
Just as ATR can help you get out of a losing trade, it can help you realize profits. Many swing traders use ATR to set realistic price targets. If a stock typically moves $3.00 a day (ATR=3) and you are looking for an intraday move, a target of $10.00 might be statistically unlikely without a major news catalyst.
Setting targets at 2x or 3x the daily ATR allows you to capture “extended” moves while exiting before the price likely reverts to its mean. This objective approach prevents the common mistake of “greed,” where traders hold on too long hoping for a moonshot that isn’t supported by current volatility levels.
The Chandelier Exit: A Specialized ATR Tool
The Chandelier Exit is a volatility-based trailing stop-loss system developed by Charles LeBeau. It is designed to keep traders in a trend until a significant reversal occurs. The exit “hangs” from the highest high (in an uptrend) or the lowest low (in a downtrend), hence the name.
The formula for a Chandelier Exit in a long position is: Highest High in Period – (ATR x Multiple). As the stock makes new highs, the stop-loss moves up. However, if the stock moves sideways or drops slightly, the stop remains at its highest point. It only triggers when the price drops significantly enough to cross the ATR-defined threshold.
Advantages of Volatility Trailing Stops
Traditional trailing stops move based on a fixed percentage. However, a 5% drop in a low-volatility utility stock might mean the trend is over, whereas a 5% drop in a tech startup might be a standard Tuesday. The Chandelier Exit adapts to these nuances.
- It prevents premature exits during minor pullbacks.
- It locks in profits as the trend progresses.
- It provides a clear, emotionless signal for when to exit a trade.
Setting the Multiple for Your Style
Day traders might use a 2.5x ATR multiple on a 15-minute chart to capture quick intraday swings. Position traders might use a 3.5x ATR multiple on a weekly chart to ride major macro trends. Finance Solute recommends backtesting different multiples on your specific asset to find the “sweet spot” where you avoid noise but exit before significant capital erosion.
ATR and the Concept of “Volatility Squeeze”
One of the most profitable ways to use ATR is identifying the “Volatility Squeeze.” This occurs when the ATR drops to multi-month or multi-year lows. Low volatility is not a permanent state; it is a sign of consolidation. When the market stops moving, it is often gathering strength for a massive breakout.
Traders often combine ATR with Bollinger Bands to identify these moments. When the Bollinger Bands narrow and the ATR is at the bottom of its historical range, a breakout is imminent. While ATR won’t tell you the direction of the breakout, it tells you that a “volatility expansion” is coming, allowing you to prepare your entry orders above and below the consolidation zone.
Case Study: Identifying a Breakout
Imagine a stock that has been trading between $48 and $52 for several weeks. Its 14-day ATR has steadily declined from $2.50 to $0.80. This tells the trader that the range is tightening significantly. When the price finally breaks $52 and the ATR begins to tick upward, it confirms that the breakout is accompanied by increasing volatility—a strong sign of a sustained move.
Conversely, if a price breaks a level but ATR remains low or continues to fall, it may be a “fake-out.” Without the expansion of volatility, there is often insufficient “fuel” to keep the price moving in the breakout direction.
Common Pitfalls and How to Avoid Them
Despite its utility, the Average True Range is not a magic wand. Like any technical tool, it has limitations that can lead to losses if misunderstood. Finance Solute emphasizes a holistic approach where ATR is used in conjunction with other indicators like Volume, RSI, or Moving Averages.
One primary mistake is using ATR as a standalone entry signal. Seeing ATR rise does not mean you should buy or sell; it simply means the price is moving faster. Entering a trade based solely on an ATR spike is a recipe for getting caught in a “blow-off top” or a “liquidation event.”
The Lagging Nature of ATR
Because ATR is a moving average, it is a lagging indicator. It reflects what has happened in the recent past. During a sudden “Black Swan” event, the ATR might take several days to catch up to the true level of market panic. Traders must be aware that in moments of extreme market stress, the historical ATR might understate the current risk.
- Solution: Use a shorter ATR period (e.g., 5 or 7) during high-impact news weeks.
- Solution: Always have a hard “emergency” stop-loss in place that doesn’t rely solely on indicator calculations.
Over-reliance on Default Settings
The “14-period” default is a legacy from daily commodity charts. If you are trading 1-minute scalping setups or 1-month macro trends, the 14-period setting may not be optimal. Professional traders constantly calibrate their tools. Finance Solute suggests analyzing the historical “volatility profile” of your asset to determine if a more responsive or a more filtered ATR is appropriate for your goals.
Conclusion: Integrating ATR into Your Professional Strategy
The Average True Range is more than just a line on a chart; it is a fundamental measurement of market psychology and mechanics. By quantifying volatility, it bridges the gap between theoretical strategy and practical execution. Whether you are using it to size your positions, set dynamic stop-losses, or identify impending market breakouts, ATR provides the data necessary to trade with confidence and discipline.
At Finance Solute, we believe that the difference between a gambler and a trader is the management of risk. By mastering the ATR, you take a significant step toward professional-grade risk management. It allows you to respect the market’s “breathing room” while ensuring that you aren’t swept away when the winds of volatility turn into a storm. Start incorporating ATR into your daily routine, respect the data it provides, and watch your trading consistency reach new heights.
Watch more
- Advcash Wallet Review: Features, Fees, and Global Card Solutions
- What is DeFi? The Future of Decentralized Finance and DeFi Coin
- What is a Node? The Essential Guide to Blockchain Nodes
- t.me/finance_solutes
- Website: https://finance-solutes.com
- Hotline: +1 929 5636 439 ( Hotline )
- 26 Broadway, Suite 934, New York, 10004, US
